|
|
|
|
Seismic data interpolation using generalised velocity-dependent seislet transform |
Next: Field Example Up: Liu et al.: Interpolation Previous: Modified Bregman iteration for
|
|
|
|
Seismic data interpolation using generalised velocity-dependent seislet transform |
First, we applied the method to a 2D synthetic prestack dataset
(Figure 1a), which was created from a 2D slice of
the benchmark French model (French, 1974). The reflector with round
dome and corners creates reflection events along midpoint and offset
axes. The inflection points of the reflector lead to traveltime
triplications at some offsets. Then we removed 70% of randomly
selected traces (Figure 1b) from the input data
(Figure 1a). We directly used NMO
equation 3 to analyze data with missing traces because the
dataset is limited in a near-offset range. The scanned parameters were
obtained and the results are shown in Figure 2a. The
velocity spectra of NMO from data show that the picked velocities are
reasonable because velocity scan is less sensitive to missing
traces. Next, we calculated the velocity-dependent (VD) slopes using
the NMO velocities. The VD slopes calculated from
equation 5 with ![]() provided accurate results
(Figure 2b). Data interpolation with the help of
modified Bregman iteration (equations 13
and 14) recovers missing traces as long as seismic
data are sufficiently sparse in the transform domain. To demonstrate
the superior sparseness of the generalized VD-seislet coefficients, we
compare the proposed method with Fourier projection onto convex sets
(POCS) interpolation method (Abma and Kabir, 2006a). The results of the
interpolation are shown in Figure 3a after
carefully selecting parameters. 50 iterations were selected as
comparable computational cost as the modified Bregman iteration. Some
artificial events were created because Fourier transform cannot
provide a naturally sparse domain for curved events. The interpolated
error is also slightly large at the locations of the gaps
(Figure 4a). The interpolated results can only be
partially improved by cutting data into overlapping windows, unless
the events display an ideal plane-wave pattern in each window. The
generalized VD-seislet transform provides a much sparser domain for
reflections. Therefore, the modified Bregman iteration successfully
interpolates missing traces (Figure 3b). The number
of iteration for the proposed method is 20, which is less than that of
Fourier POCS. The difference between the interpolated result and
Figure 1a also shows that the proposed method
provides reasonable results, in which parts of diffraction events are
lost (Figure 4b).
provided accurate results
(Figure 2b). Data interpolation with the help of
modified Bregman iteration (equations 13
and 14) recovers missing traces as long as seismic
data are sufficiently sparse in the transform domain. To demonstrate
the superior sparseness of the generalized VD-seislet coefficients, we
compare the proposed method with Fourier projection onto convex sets
(POCS) interpolation method (Abma and Kabir, 2006a). The results of the
interpolation are shown in Figure 3a after
carefully selecting parameters. 50 iterations were selected as
comparable computational cost as the modified Bregman iteration. Some
artificial events were created because Fourier transform cannot
provide a naturally sparse domain for curved events. The interpolated
error is also slightly large at the locations of the gaps
(Figure 4a). The interpolated results can only be
partially improved by cutting data into overlapping windows, unless
the events display an ideal plane-wave pattern in each window. The
generalized VD-seislet transform provides a much sparser domain for
reflections. Therefore, the modified Bregman iteration successfully
interpolates missing traces (Figure 3b). The number
of iteration for the proposed method is 20, which is less than that of
Fourier POCS. The difference between the interpolated result and
Figure 1a also shows that the proposed method
provides reasonable results, in which parts of diffraction events are
lost (Figure 4b).


|
|---|
|
data,miss
Figure 1. Synthetic prestack data from the benchmark French model (a) and data with 70% traces removed (b). |
|
|


|
|---|
|
pick,dip
Figure 2. Velocity spectra by using NMO equation (a) and local slopes calculated by equation 5 with |
|
|


|
|---|
|
pocs,inter
Figure 3. Interpolated results by using different methods. Fourier POCS method (a) and the proposed method (b). |
|
|


|
|---|
|
diff2,diff
Figure 4. The difference between interpolated results and synthetic prestack data. Fourier POCS method (a) and the proposed method (b). |
|
|
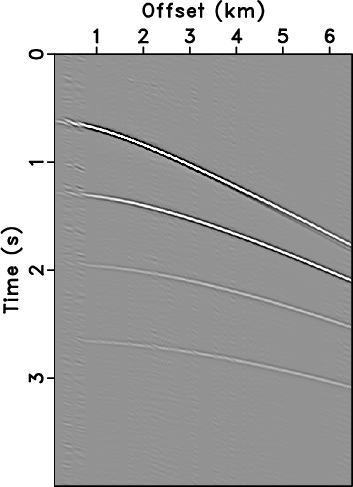
The second example is shown in Figure 5a. The amplitudes of the four reflection events show variation because of anisotropy. To evaluate missing trace interpolation (Figure 5b), we removed 70% of randomly selected traces from the input data (Figure 5a). The variation of amplitude and curvature makes it difficult to recover the missing traces. The interpolated results are shown in Figure 6b, which uses the generalized velocity-dependent (VD)-seislet transform and the modified Bregman iteration with 99% percentile-based soft thresholding. The number of iteration is 20. In the interpolated result, it was visually difficult to distinguish the missing trace locations, which indicates successful interpolation. For comparison, we applied the Fourier POCS method to interpolate the missing traces (Figure 6a). The data were divided into seven patches with 43% overlap along the space axis and 200 iterations were run. The POCS method produces a reasonable result after carefully selecting parameters, but some artificial events were still present becausethe uniformed patching windows cannot guarantee the assumption of stationary plane waves.


|
|---|
|
clean,mask
Figure 5. Synthetic data of VTI media (a) and data with 70% traces removed (b). |
|
|

|
|---|
|
pocss,sinterd
Figure 6. Interpolated results by using different methods. Fourier POCS method with patching (a) and the proposed method (b). |
|
|
|
|
|
|
Seismic data interpolation using generalised velocity-dependent seislet transform |