|
|
|
|
Time migration velocity analysis by velocity continuation |
The synthetic test uses constant-velocity prestack modeling and migration to check the validity of the method when all the theoretical requirements are satisfied. The data were generated from the synthetic reflectivity model (Figure 2) and included 60 offsets ranging from 0 to 0.5 km. The exact velocity in the model is 1.5 km/s, and the initial velocity for starting the continuation process was chosen at 2 km/s.
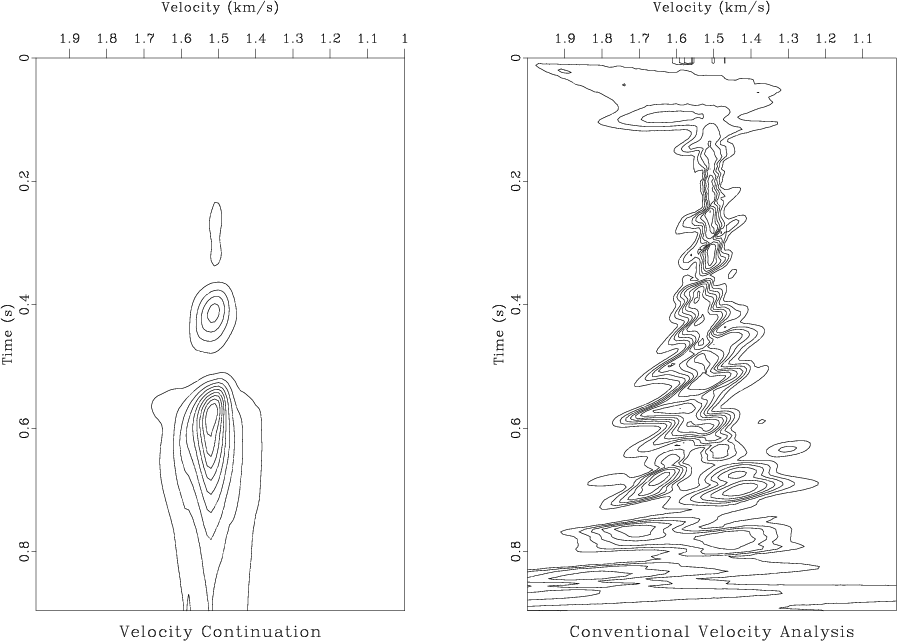
Figure 11 compares the semblance panels for migration velocity analysis using velocity continuation and using the conventional (NMO) analysis. In the top part of the image, both panels show maximum picks at the correct velocity (1.5 km/s). The advantage of velocity continuation is immediately obvious in the deeper part of the image, where the events are noticeably better focused.
|
|---|
|
sig-mva1
Figure 11. Semblance panels for migration velocity analysis at the common image point 1 km. Left: after velocity continuation. Right: after conventional (NMO) velocity analysis. In a structurally complex region, velocity continuation clearly provides better focusing. The correct velocity is 1.5 km/s. |
|
|
The final result of velocity continuation (after picking maximum semblance and slicing in the velocity cube) is shown in the bottom left plot of Figure 12. For comparison, Figure 12 also shows the result of migration with the correct velocity (the top left plot), initial velocity (the top right plot), and the result of velocity slicing after the simple NMO correction, corresponding to the conventional MVA (the bottom right plot). The same velocity picking and slicing program was used in both cases. The comparison clearly shows that, in this simple example, velocity continuation is able to accurately reproduce the correct image without using any prior information about the migration velocity and without any need for repeating the prestack migration procedure. Velocity continuation correctly images events with conflicting dips by properly taking into account both vertical and lateral shifts in the image position.

|
|---|
|
sig-all
Figure 12. Velocity continuation tested on the synthetic example. Top left: prestack migration with the correct velocity of 1.5 km/s. Top right: prestack migration with the velocity of 2 km/s. Bottom left: the result of velocity continuation. Bottom right: the result from picking migration image after only conventional NMO correction. |
|
|
|
|
|
|
Time migration velocity analysis by velocity continuation |