|
|
|
|
Post-stack velocity analysis by separation and imaging of seismic diffractions |
|
|---|
|
panel
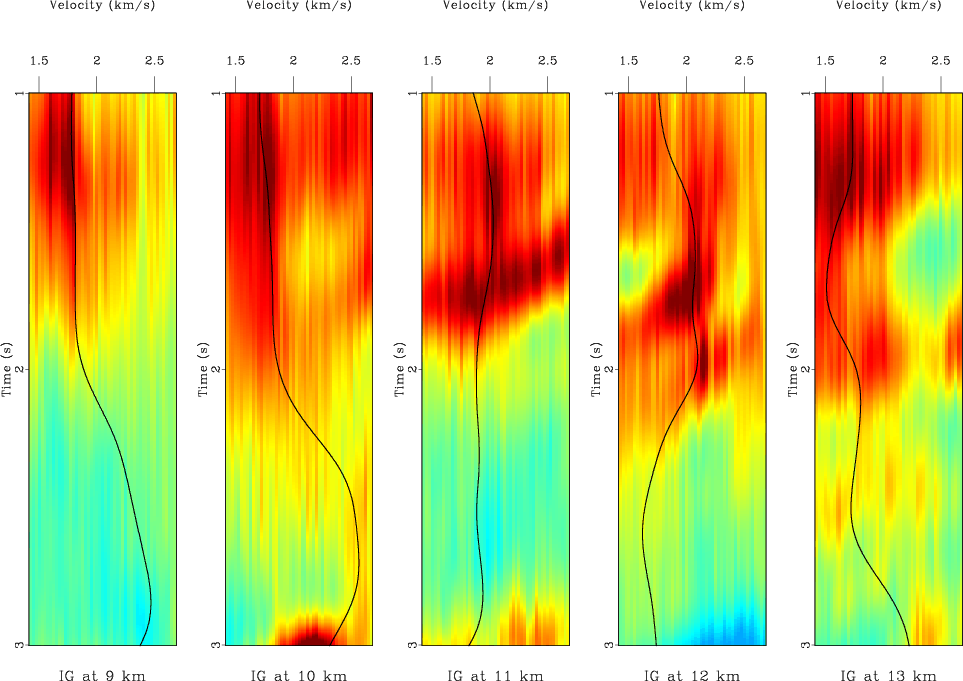
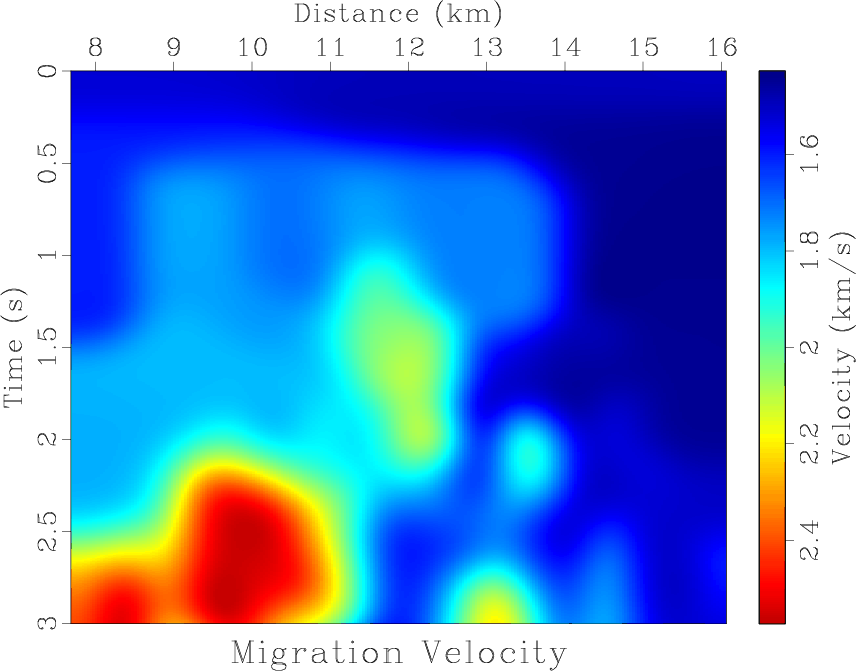
Figure 1. Focusing image gathers (FIG) for post-stack migration velocity analysis by diffraction focusing. Red colors indicate strong focusing. Superimposed black curves are slices of the picked migration velocity shown in Figure 3b. |
|
|
|
|---|
|
bei-stk2,bei-dip
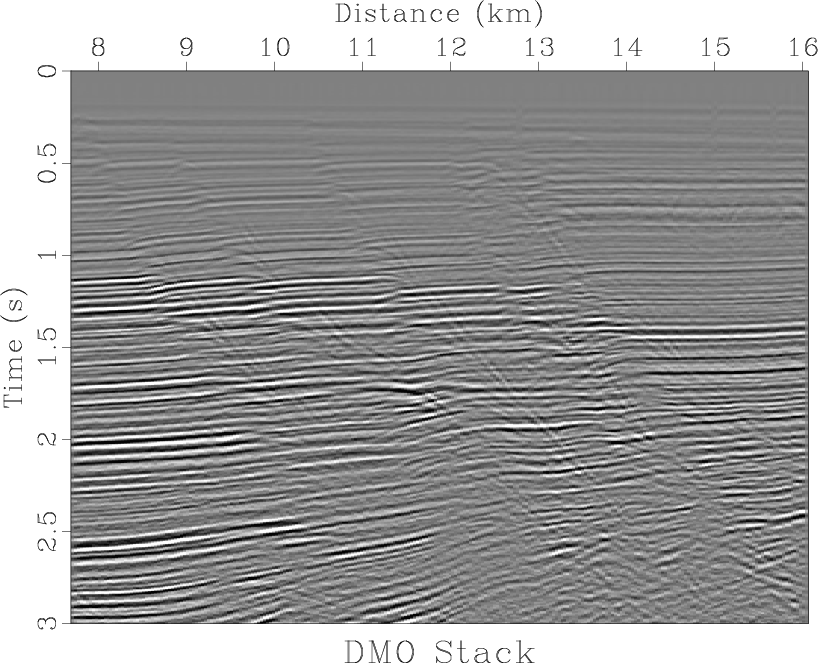
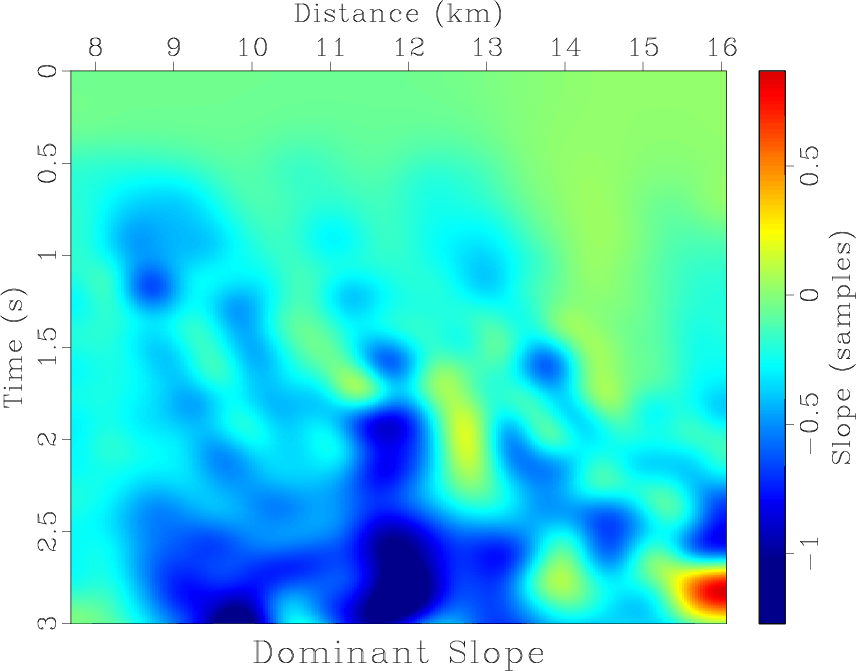
Figure 2. First test example. (a) Stacked section from a Gulf of Mexico dataset. (b) Local slopes estimated by plane-wave destruction. |
|
|
|
|---|
|
bei-pwd,bei-pik
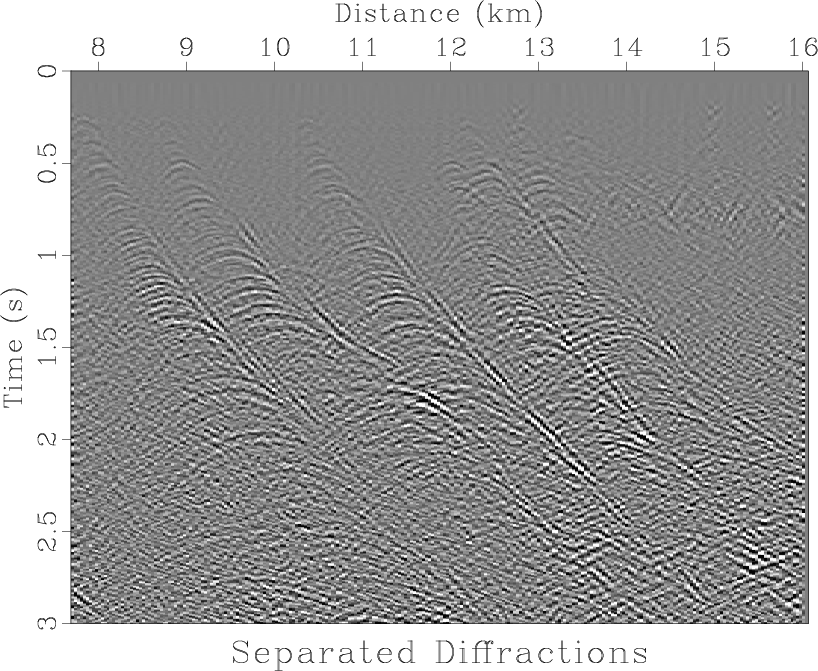
Figure 3. Diffraction separation. (a) Diffraction events separated from data in Figure 2a. (b) Migration velocity picked from local varimax scans after velocity continuation of diffractions. |
|
|
|
|---|
|
bei-slc,bei-slc2
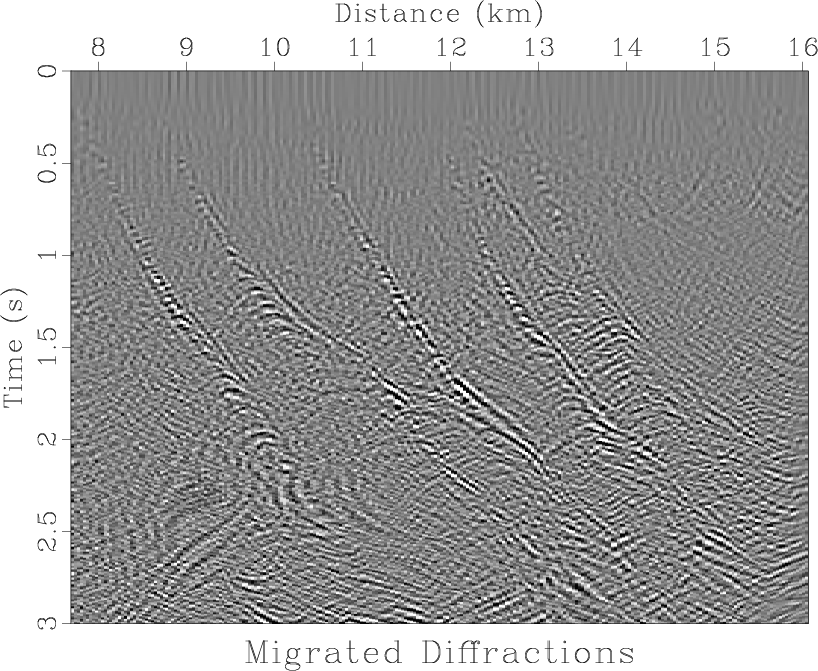
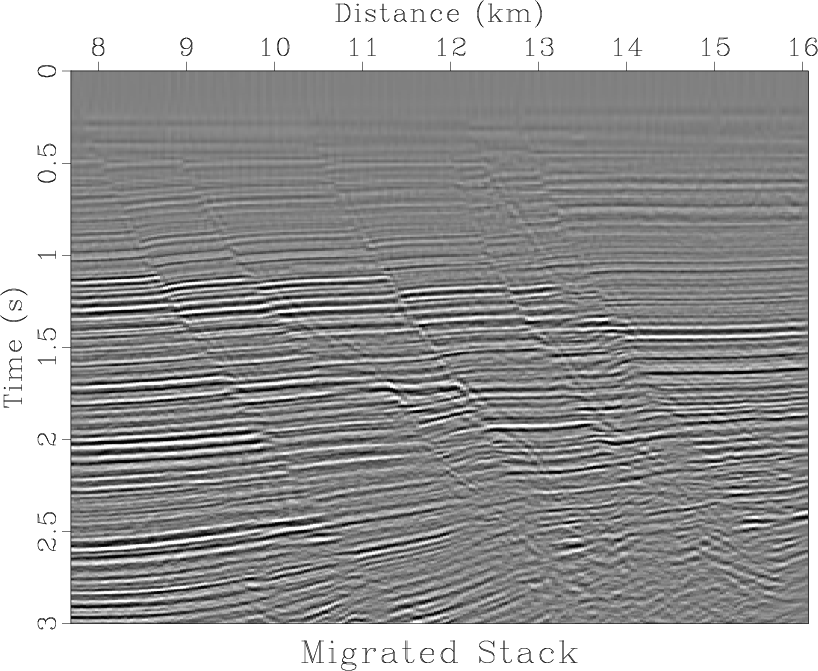
Figure 4. Migrated images. (a) Migrated diffractions from Figure 3a. (b) Initial data from Figure 2a migrated with velocity estimated by diffraction imaging. |
|
|
The data for our first example are shown in Figure 2a, which displays a stacked section of a vintage Gulf of Mexico dataset (Claerbout, 2005). Diffractions caused by irregular fault boundaries are preserved in the stack thanks to dip moveout processing but are hardly visible underneath strong reflection responses. Figure 2b shows the dominant slope of reflection events estimated by the plane-wave destruction method. Numerous diffractions were separated from reflections by plane-wave destruction and are shown in Figure 3a.
Figure 3b shows the migration velocity picked from focusing common-image gathers (FIGs). Example FIGs are shown in Figure 1. Figure 4a is the image of diffracted events, which collapse to collectively form fault surfaces. Figure 4b is the image obtained by migrating the original stack with velocities estimated from diffraction focusing analysis. In this final image, fault surfaces align with discontinuities in seismic reflectors. The image compares favorably with images of the same dataset from the conventional processing shown by Claerbout (2005).
|
|
|
|
Post-stack velocity analysis by separation and imaging of seismic diffractions |