|
|
|
|
Predictive painting of 3-D seismic volumes |
|
|---|
|
sigmoid,sdip
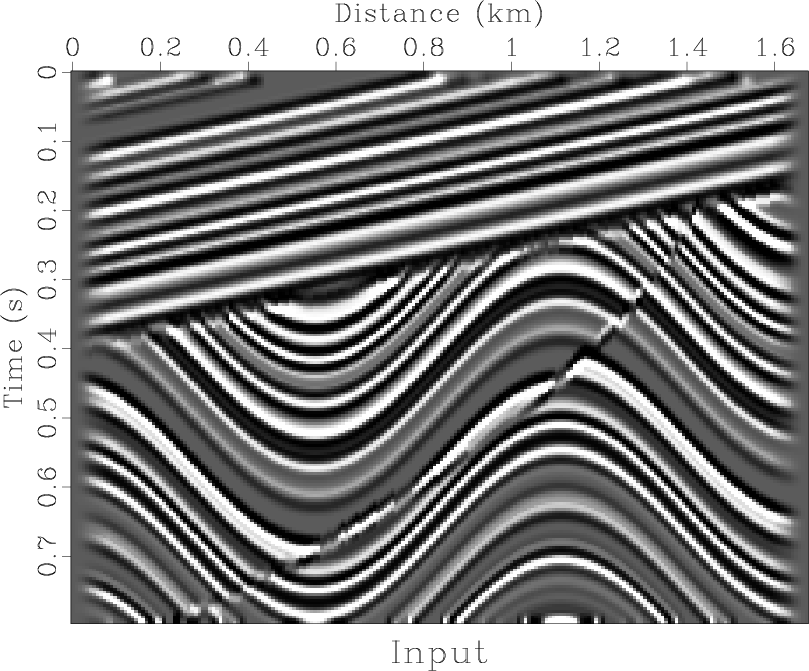
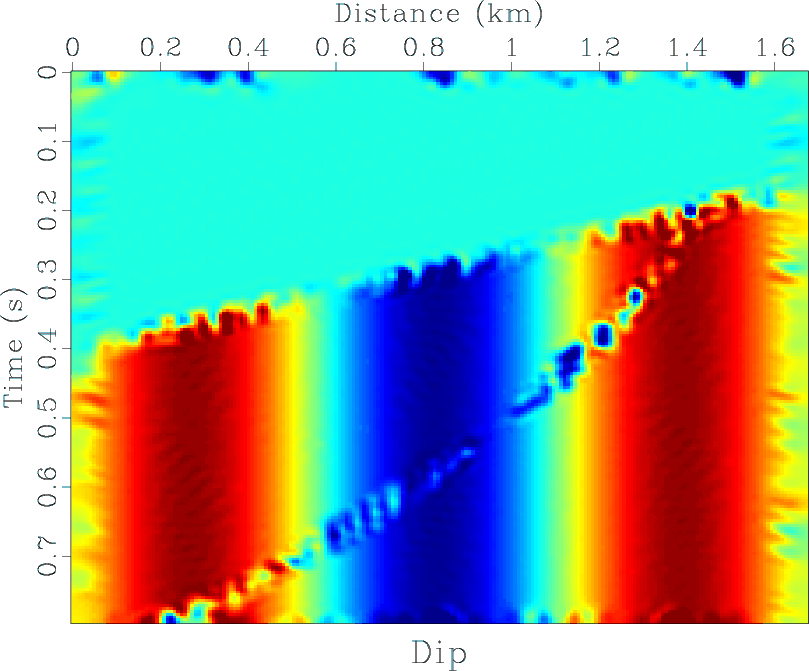
Figure 1. (a) Synthetic image from Claerbout (2006). (b) Local dip estimate. |
|
|
|
|---|
|
spaint,spick
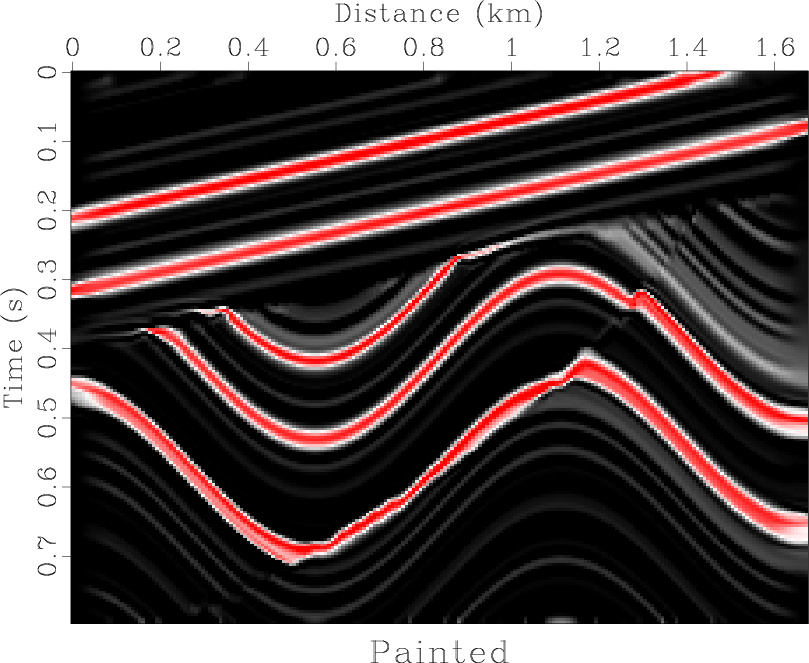
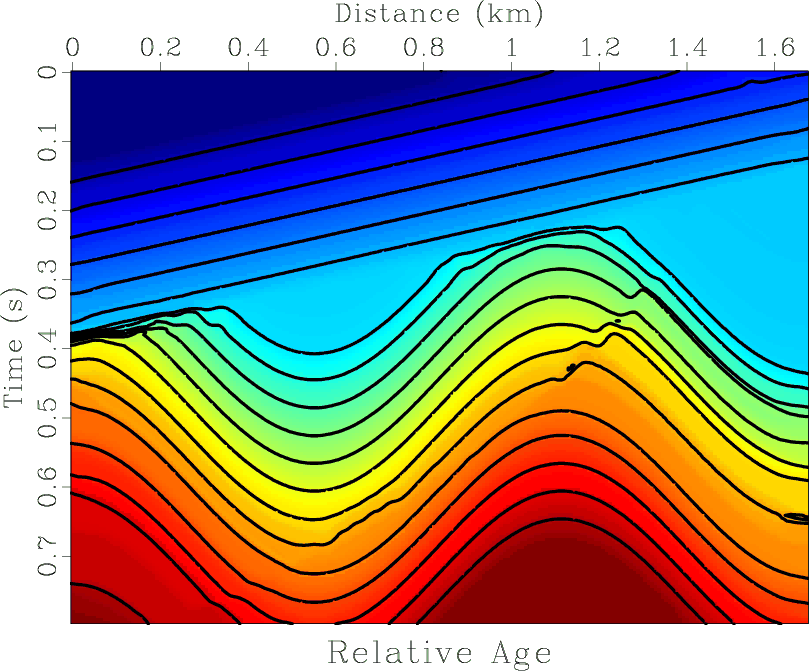
Figure 2. Predictive painting using synthetic image from Figure 1a. (a) Painted horizons. (b) Painted relative age. The reference trace is in the center of the image. |
|
|
|
|---|
|
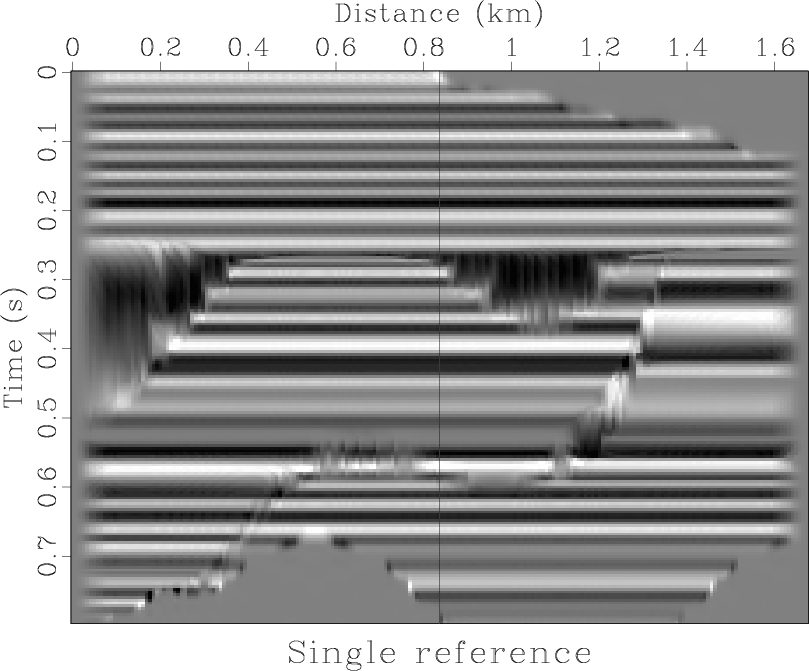
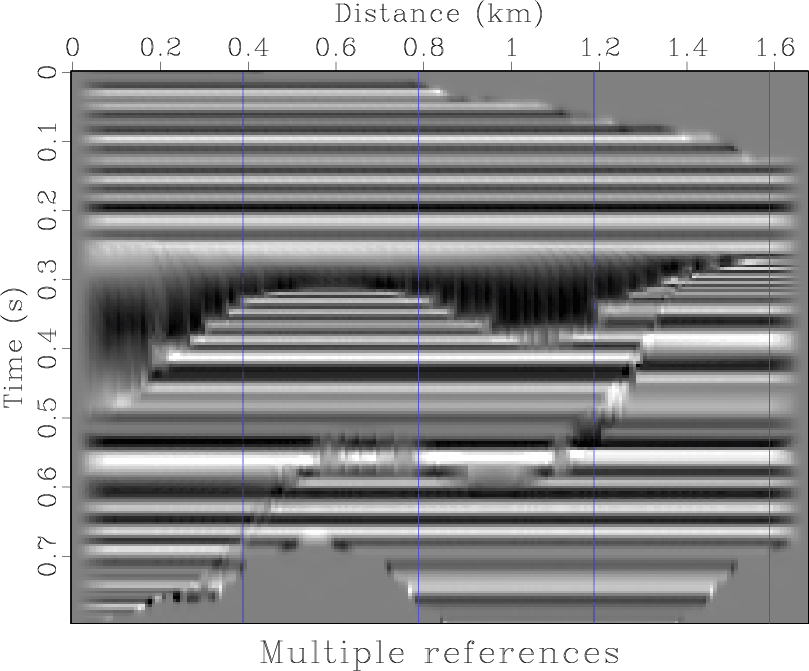
sflat,flat
Figure 3. Synthetic image from Figure 1a flattened using a single reference trace (a) and multiple references (b). The reference traces are marked by vertical lines. |
|
|
The input for the first example is borrowed from Claerbout (2006) and shown in Figure 1a. It is a synthetic seismic image containing dipping beds, an uncomformity, and a fault. Figure 1b shows local dips measured by the plane-wave destruction algorithm. The slope estimate correctly depicts the constant dip in the top part of the image and the sinusoidal variation of the dip in the bottom. Figure 2a shows the output of predictive painting: I assign the reference trace, selected in the middle of the image, with several horizon picks, which are then automatically spread into the image space by using prediction operators from equation 5. Figure 2b shows another kind of painting: This time, the reference trace contains simply the time values along this trace. When spread by predictive painting, it turns into the relative geologic age attribute, as defined by Stark (2004). Relative age indicates how much a given trace is shifted with respect to the reference trace. Unshifting each trace accomplishes automatic flattening. The result is shown in Figure 3a. Most of the horizons are successfully flattened, although the algorithm fails to ``heal'' some of events across the fault because of significant structural discontinuities. In cases like that, the geological insight of the interpreter is invaluable and cannot be easily replaced by an automatic algorithm.
One reference trace is not necessarily structurally connected to all events in the volume. By using multiple references and averaging the relative age among all of them, one can obtain a more accurate extraction of stratal slice information. The result of using multiple references, shown in Figure 3b, contains more detailed information about horizons that are not structurally visible from the single reference trace.
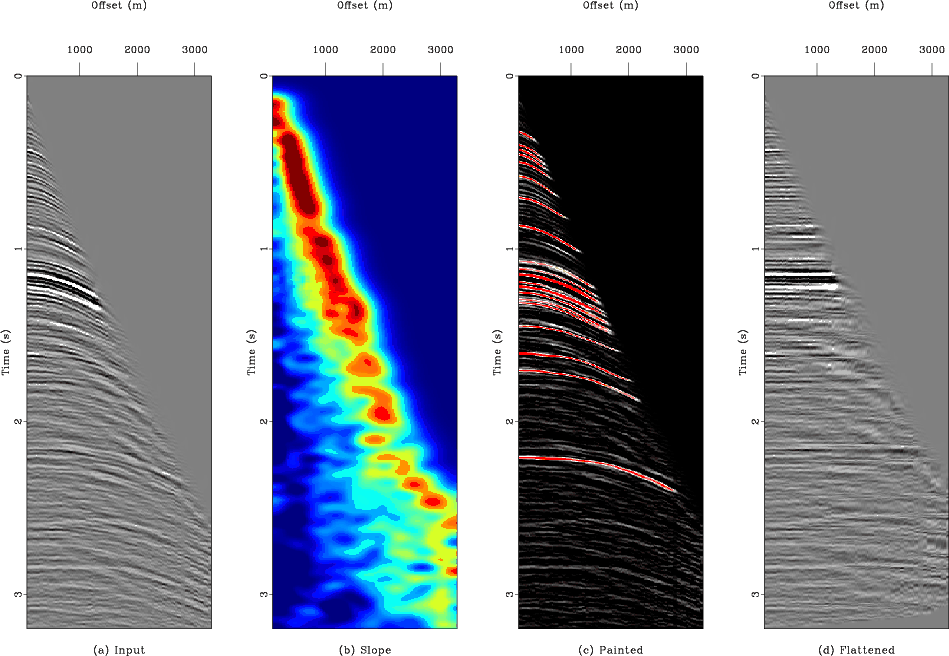
As mentioned in the introduction, flattening and automatic picking of horizons are useful not only for post-stack structural interpretation but also for prestack data analysis. Figure 4 shows an application of 2-D predictive painting to a marine CMP (common midpoint) gather. After the field of local slopes has been found (Figure 4b), predictive painting is applied to mark individual events (Figure 4c) or to flatten them (Figure 4d), which effectively accomplishes moveout correction. This processing is automatic and does not require manual picking or any prior assumption on the moveout shape. After extracting the moveout information, the moveout parameters can be estimated by least-squares fitting, as described by Burnett and Fomel (2009). It is important to note that the gather flattening method is prone to errors in the presence of crossing events, such as multiple reflections, since only the dominant slopes of the strongest events are going to be picked up by the slope estimation procedure.
|
|---|
|
pgath
Figure 4. A marine CMP gather (a), estimated local slopes (b), events marked by predictive painting (c), and flattening (d). |
|
|
|
|
|
|
Predictive painting of 3-D seismic volumes |