next up previous [pdf]

Next: Numerical examples Up: Comparison of accuracy between Previous: Error analysis using the

The accuracy estimation for planar interface

For seismic modeling, it is important to estimate the accuracy of the proposed methods for heterogeneous media, especially for the amplitude variation with offset(AVO) or amplitude variation with angle(AVA) effects of reflected or transmitted wavefields along the interface. The theoretical analysis of this feature can be complicated. Here, we provide a simple numerical test to illustrate the accuracy of the proposed methods. We design a planar interface model which is defined on a grid system of $ 601\times501$ with a space interval of $ 10m$ in both horizontal and vertical direction, as shown in figure 10. The planar interface is aligned with the vertical $ 251th$ grid. The velocities of upper and lower layer are designed as $ 4000m/s$ and $ 2000m/s$ to avoid critical reflection. We use constant density $ \rho=1700 kg/m^3$ . We synthesize a shot record to examine the accuracy of our methods. The source is located at the position of $ 3000m$ in horizontal direction and $ 1500m$ in vertical direction. Thus the maximum incident angle is $ 71.6^{\circ}$ . We place two receiver lines above and below the interface and measure the amplitudes of incident, reflected and transmitted wavefields. The reflection coefficient is given by the ratio of amplitudes of the reflected wavefield and the incident wavefield. The transmission coefficient is given by the ratio of amplitudes of transmitted wavefield and reflected wavefield. Figure 11 compares the reflection and transmission coefficients calculated by the SGL and SGLFD methods with the theoretical values calculated by solving Zoeppritz equations. From this figure, we see that the reflection and transmission coefficients calculated by the SGL and SGLFD method match well with the theoretical values. Thus, both the SGL and SGLFD methods appear sufficiently accurate to provide correct dynamic information of wavefields.

geo
geo
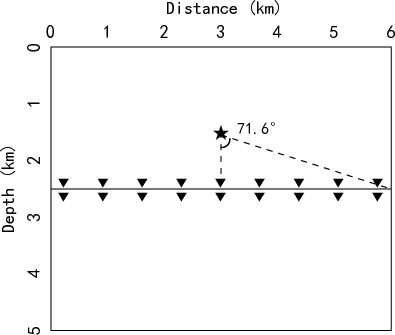
Figure 10.
The geometry of the planar interface model. The star denotes the source location and the triangles denote the receiver locations. The values of incident angle along the planar interface are between 0 and $ 71.6$ degree.
[pdf] [png]

rpp tpp
rpp,tpp
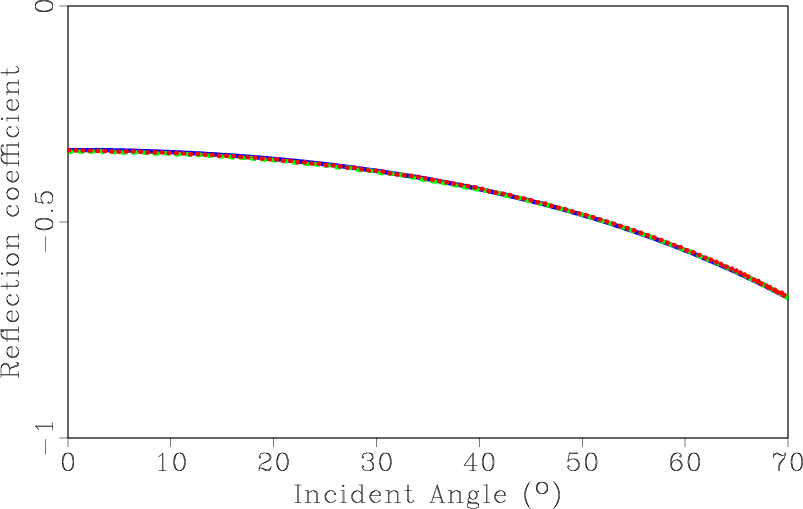
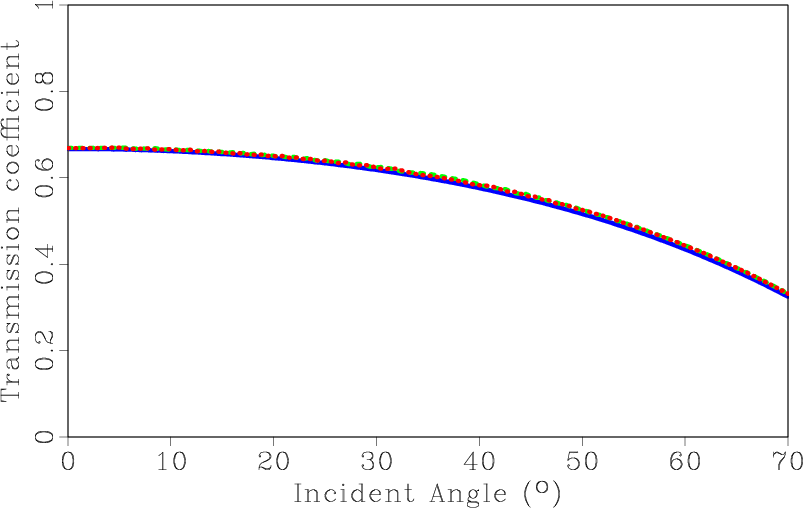
Figure 11.
Comparison of reflection (a) and transmission (b) coefficients calculated by the SGL method (red dashed line) and the SGLFD method (green dashed line) with the theoretical values (blue solid line).
[pdf] [pdf] [png] [png] [scons]


next up previous [pdf]

Next: Numerical examples Up: Comparison of accuracy between Previous: Error analysis using the

2014-06-02