 |
 |
 |
 | Moveout, velocity, and stacking |  |
![[pdf]](icons/pdf.png) |
Next: Stabilizing RMS velocity
Up: VELOCITY SPECTRA
Previous: VELOCITY SPECTRA
For many kinds of data analysis,
we need to know the velocity of the earth as a function of depth.
To derive such information
we begin from Figure 4.8
and draw a line through the maxima.
In practice this is often a tedious manual process,
and it needs to be done everywhere we go.
There is no universally accepted way to automate
this procedure, but we will consider one
that is simple enough that it can be fully described here,
and which works well enough for these demonstrations.
(I plan to do a better job later.)
Theoretically we can define the velocity or slowness
as a function of traveltime depth by the moment function.
Take the absolute value of the data scans and smooth
them a little on the time axis to make something like an unnormalized
probability function, say  .
Then the slowness
.
Then the slowness  could be defined by the moment function, i.e.,
 |
(12) |
The problem with defining slowness by the moment is that it is
strongly influenced by noises away from the peaks,
particularly water velocity noises.
Thus, better results can be obtained if the sums in equation (4.12)
are limited to a range about the likely solution.
To begin with, we can take the likely solution to be defined
by universal or regional experience.
It is sensible to begin from a one-parameter equation
for velocity increasing with depth where the form of the equation
allows a ray tracing solution
such as equation (![[*]](icons/crossref.png) ).
Experience with Gulf of Mexico data shows that
).
Experience with Gulf of Mexico data shows that
 is reasonable there
for equation ().
is reasonable there
for equation ().
Experience with moments,
equation (4.12),
shows they are reasonable when
the desired result is near the guessed center of the range.
Otherwise, the moment is biased towards the initial guess.
This bias can be reduced in stages.
At each stage we shrink the width of the zone used to compute the moment.
A more customary way to view velocity space
is to square the velocity scans
and normalize them by the sum of the squares of the signals.
This has the advantage that the remaining information
represents velocity spectra
and removes variation due to seismic amplitudes.
Since in practice, reliability seems somehow proportional to amplitude
the disadvantage of normalization
is that reliability becomes more veiled.
fit
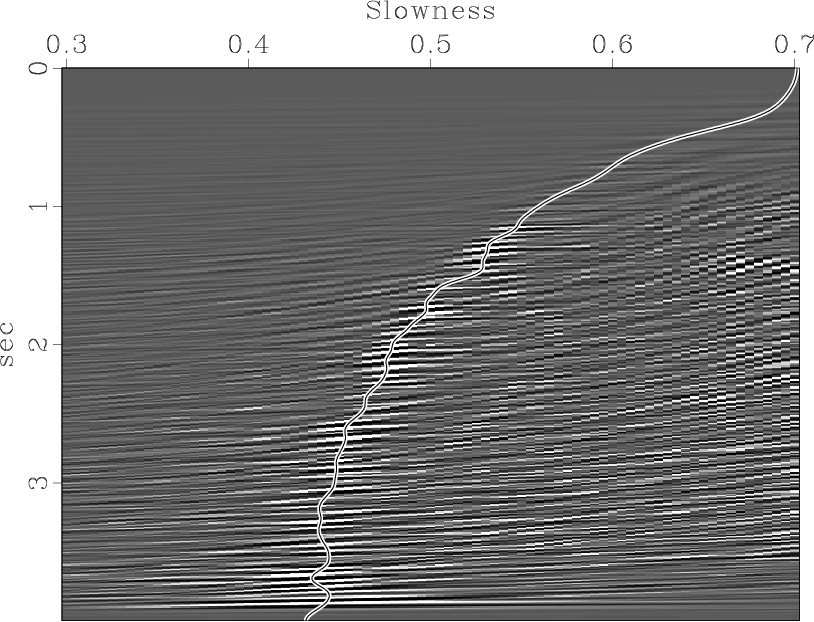
Figure 9.
Slowness scans.
Overlaying is the line of slowness picks.
|
|
![[png]](icons/viewmag.png) ![[scons]](icons/configure.png)
|
|---|
|
|
|
|
| Moveout, velocity, and stacking | |
|
Next: Stabilizing RMS velocity
Up: VELOCITY SPECTRA
Previous: VELOCITY SPECTRA
2009-03-16