|
|
|
|
Waves in strata |
The nearly vertically-propagating waves (reflections) spread out essentially in three dimensions, whereas the nearly horizontally-going waves never get deep into the earth because, as we will see, they are deflected back upward by the velocity gradient. Thus horizontal waves spread out in essentially two dimensions, so that energy conservation suggests that their amplitudes should dominate the amplitudes of reflections on raw data. This is often true for ground roll. Head waves, on the other hand, are often much weaker, often being visible only because they often arrive before more energetic waves. The weakness of head waves is explained by the small percentage of solid angle occupied by the waves leaving a source that eventually happen to match up with layer boundaries and propagate as head waves. I selected the examples below because of the strong headwaves. They are nearly as strong as the guided waves. To compensate for diminishing energy with distance, I scaled data displays by multiplying by the offset distance between the shot and the receiver.
In data display, the slowness (slope of the time-distance curve)
is often called the stepout ![]() . Other commonly-used names for
this slope are time dip and reflection slope.
The best way to view waves with linear moveout
is after time shifting to remove a standard linear moveout
such as that of water.
An equation for the shifted time is
. Other commonly-used names for
this slope are time dip and reflection slope.
The best way to view waves with linear moveout
is after time shifting to remove a standard linear moveout
such as that of water.
An equation for the shifted time is
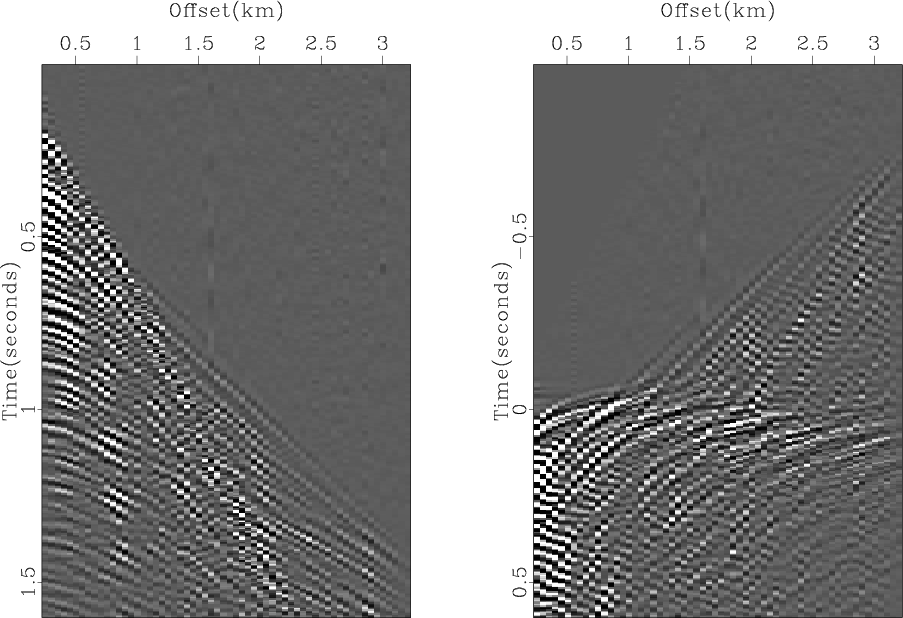
Ground roll and guided waves are typically slow because materials near the earth's surface typically are slow. Slow waves are steeply sloped on a time-versus-offset display. It is not surprising that marine guided waves typically have speeds comparable to water waves (near 1.47 km/s approximately 1.5 km/s). It is perhaps surprising that ground roll also often has the speed of sound in water. Indeed, the depth to underground water is often determined by seismology before drilling for water. Ground roll also often has a speed comparable to the speed of sound in air, 0.3 km/sec, though, much to my annoyance I could not find a good example of it today. Figure 3.2 is an example of energetic ground roll (land) that happens to have a speed close to that of water.
|
|---|
|
wzl-34
Figure 2. Land shot profile (Yilmaz and Cumro) #39 from the Middle East before (left) and after (right) linear moveout at water velocity. |
|
|
The speed of a ray traveling along a layer interface is the rock speed in the faster layer (nearly always the lower layer). It is not an average of the layer above and the layer below.
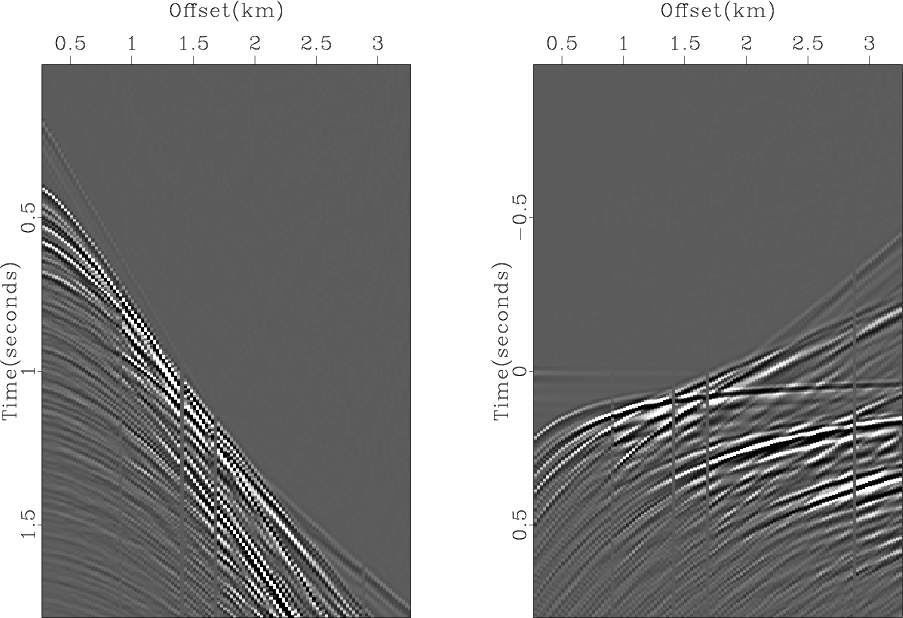
Figures 3.3 and 3.4
are examples of energetic marine guided waves.
In Figure 3.3
at ![]() (designated t-t_water) at small offset
is the wave that travels directly from the shot to the receivers.
This wave dies out rapidly with offset
(because it interferes with a wave of opposite polarity
reflected from the water surface).
At near offset slightly later than
(designated t-t_water) at small offset
is the wave that travels directly from the shot to the receivers.
This wave dies out rapidly with offset
(because it interferes with a wave of opposite polarity
reflected from the water surface).
At near offset slightly later than ![]() is the water bottom reflection.
At wide offset, the water bottom reflection is quickly followed
by multiple reflections from the bottom.
Critical angle reflection is defined as where the head wave
comes tangent to the reflected wave.
Before (above)
is the water bottom reflection.
At wide offset, the water bottom reflection is quickly followed
by multiple reflections from the bottom.
Critical angle reflection is defined as where the head wave
comes tangent to the reflected wave.
Before (above) ![]() are the head waves.
There are two obvious slopes,
hence two obvious layer interfaces.
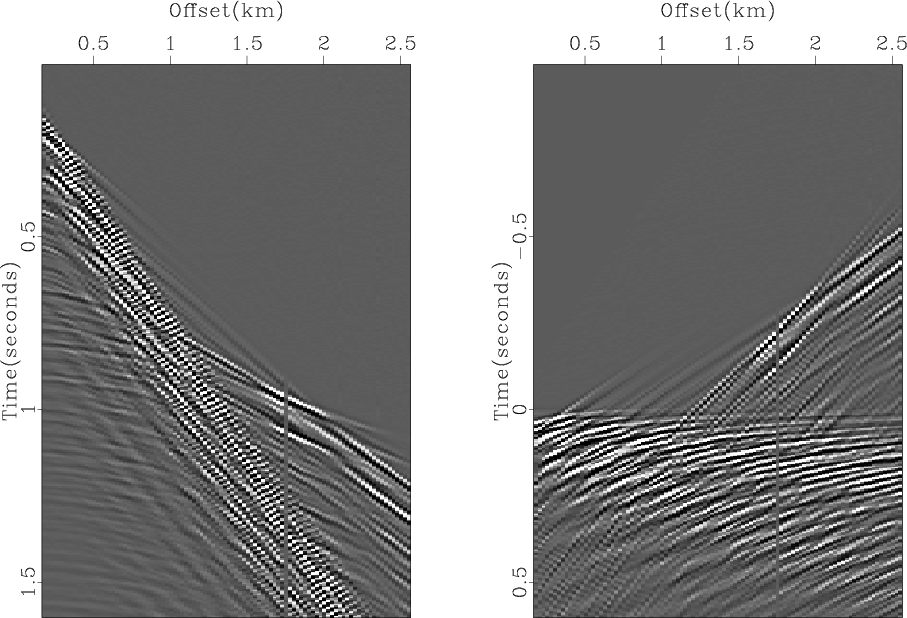
Figure 3.4 is much like Figure 3.3
but the water bottom is shallower.
are the head waves.
There are two obvious slopes,
hence two obvious layer interfaces.
Figure 3.4 is much like Figure 3.3
but the water bottom is shallower.
|
|---|
|
wzl-20
Figure 3. Marine shot profile (Yilmaz and Cumro) #20 from the Aleutian Islands. |
|
|
|
|---|
|
wzl-32
Figure 4. Marine shot profile (Yilmaz and Cumro) #32 from the North Sea. |
|
|
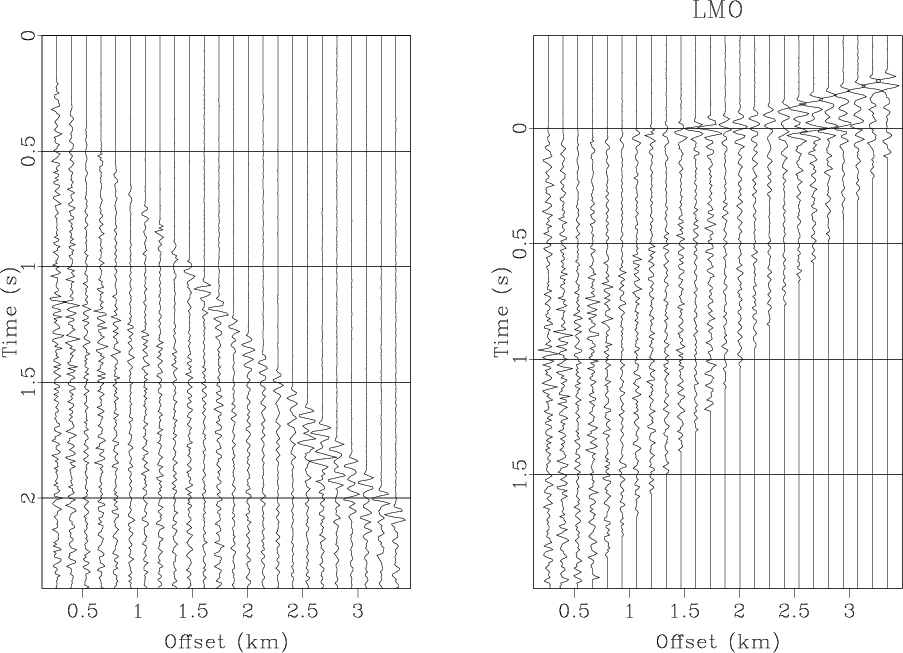
Figure 3.5 shows data where the first arriving energy is not along a few straight line segments, but is along a curve. This means the velocity increases smoothly with depth as soft sediments compress.
|
|---|
|
wglmo
Figure 5. A common midpoint gather from the Gulf of Mexico before (left) and after (right) linear moveout at water velocity. Later I hope to estimate velocity with depth in shallow strata. Press button for movie over midpoint. |
|
|
|
|
|
|
Waves in strata |