|
|
|
|
On anelliptic approximations for qP velocities in TI and orthorhombic media |
To evaluate the accuracy of the proposed approximations, we produce relative error plots and tables, using several sets of normalized stiffness tensor measurements summarized in Table 7, which can be converted to any parameterization scheme (Table 3). The error plots in Figures 4-10 are generated using the standard model (Schoenberg and Helbig, 1997) and are presented as both 3D surfaces and sterographic projections with ![]() (or
(or ![]() ) changing radially and
) changing radially and ![]() (or
(or ![]() ) changing azimuthally. The standard model assumes a shale background with a set of parallel vertical cracks; therefore, we use the following relationship between anelliptic parameters in shales:
) changing azimuthally. The standard model assumes a shale background with a set of parallel vertical cracks; therefore, we use the following relationship between anelliptic parameters in shales:
![]() to reduce the number of parameters in the vertical [
to reduce the number of parameters in the vertical [![]() ,
,![]() ] and [
] and [![]() ,
,![]() ] planes. The anisotropy in the horizontal plane [
] planes. The anisotropy in the horizontal plane [![]() ,
,![]() ], on the other hand, corresponds to a different cause, which in this case is assumed to be vertical fractures. Because we do not know a proper relationship between anelliptic parameters for such feature, we resort to the previously used assumption of
], on the other hand, corresponds to a different cause, which in this case is assumed to be vertical fractures. Because we do not know a proper relationship between anelliptic parameters for such feature, we resort to the previously used assumption of
![]() . Tables 8 and 9 show RMS relative error results of our approximations in comparison with results from some of the previously suggested approximations , which are computed based on
. Tables 8 and 9 show RMS relative error results of our approximations in comparison with results from some of the previously suggested approximations , which are computed based on
RMS error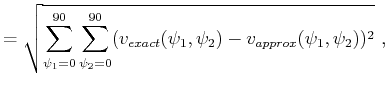 |
(61) |
| Sample | |||||||||
| 1. Standard model | 9 | 9.84 | 5.938 | 2 | 1.6 | 2.182 | 3.6 | 2.4 | 2.25 |
| 2. Tsvankin 1 | 11.7 | 13.5 | 9 | 1.728 | 1.44 | 2.246 | 8.824 | 5.981 | 5.159 |
| 3. Tsvankin 2 | 17.1 | 13.5 | 9 | 1.728 | 1.44 | 2.246 | 9.772 | 4.580 | 7.745 |
| 4. Alkhalifah 1 | 1.452 | 2.016 | 1 | 0.25 | 0.25 | 0.25 | 1.089 | 0.695 | 0.599 |
| 5. Alkhalifah 2 | 1.452 | 2.016 | 1 | 0.49 | 0.36 | 0.49 | 0.608 | 0.206 | 0.378 |
| Sample | Tsvankin (1997) | Alkhalifah (2003) | Proposed | |
| 1 | 0.5787 | 0.1742 | 0.1029 | |
| 2 | 0.5918 | 0.0645 | 0.0275 | |
| 3 | 0 .7104 | 0.0952 | 0.0637 | |
| 4 | 0.8960 | 0.1382 | 0.0293 | |
| 5 | 1.0736 | 0.3274 | 0.2084 |
| Sample | Xu-Vasconcelos | Proposed | ||
| 1 | 0.8985 | 0.1446 | ||
| 2 | 0.6066 | 0.1354 | ||
| 3 | 0.7966 | 0.0311 | ||
| 4 | 0.4907 | 0.0387 | ||
| 5 | 0.4588 | 0.1729 |


|
|---|
|
phaseweak90leglow,phaseweakleglow
Figure 4. Relative error of phase-velocity approximation by Tsvankin (1997). a) from azimuth 0 to |
|
|


|
|---|
|
phaseacoustic90leglow,phaseacousticleglow
Figure 5. Relative error of phase-velocity approximation by Alkhalifah (2003). a) from azimuth 0 to |
|
|


|
|---|
|
phasemshappq90leglownew,phasemshappqleglownew
Figure 6. Relative error of proposed six-parameter phase-velocity approximation. a) from azimuth 0 to |
|
|


|
|---|
|
phasemshtrueq90leglow,phasemshtrueqleglow
Figure 7. Relative error of proposed nine-parameter phase-velocity approximation. a) from azimuth 0 to |
|
|


|
|---|
|
groupxu90leglow,groupxuleglow
Figure 8. Relative error of group-velocity approximation by Xu et al. (2005) and Vasconcelos and Tsvankin (2006). a) from azimuth 0 to |
|
|


|
|---|
|
groupmshappq90leglownew,groupmshappqleglownew
Figure 9. Relative error of the proposed six-parameter group-velocity approximation. a) from azimuth 0 to |
|
|


|
|---|
|
groupmshtrueq90leglow,groupmshtrueqleglow
Figure 10. Relative error of the proposed nine-parameter group-velocity approximation. a) from azimuth 0 to |
|
|
|
|
|
|
On anelliptic approximations for qP velocities in TI and orthorhombic media |