|
|
|
|
Application of principal component analysis in weighted stacking of seismic data |
Next: Conclusion Up: Application of principal component Previous: Weighted stacking based on
|
|
|
|
Application of principal component analysis in weighted stacking of seismic data |
We first use a simple synthetic example to show the logic of the proposed approach. Fig. 1 shows an NMO-corrected CMP gather on the left. It is salient that there is an abnormal trace in the CMP gather. Besides, there is a significant amount of random noise in the data. For this data set, it is not plausible to directly take the arithmetic mean of the traces to stand for the zero-offset trace, since the abnormal trace will greatly degrade the fidelity of the equal-weight stacked trace and the non-gaussian random noise will cause a lot of residual noise in the stacked trace. However, the low-rank approximated data matrix (as shown in the right subfigure in Fig. 1) that alleviates the influence of the abnormal trace and non-Gaussian random noise is much cleaner and close to the ideal NMO-corrected CMP gather.
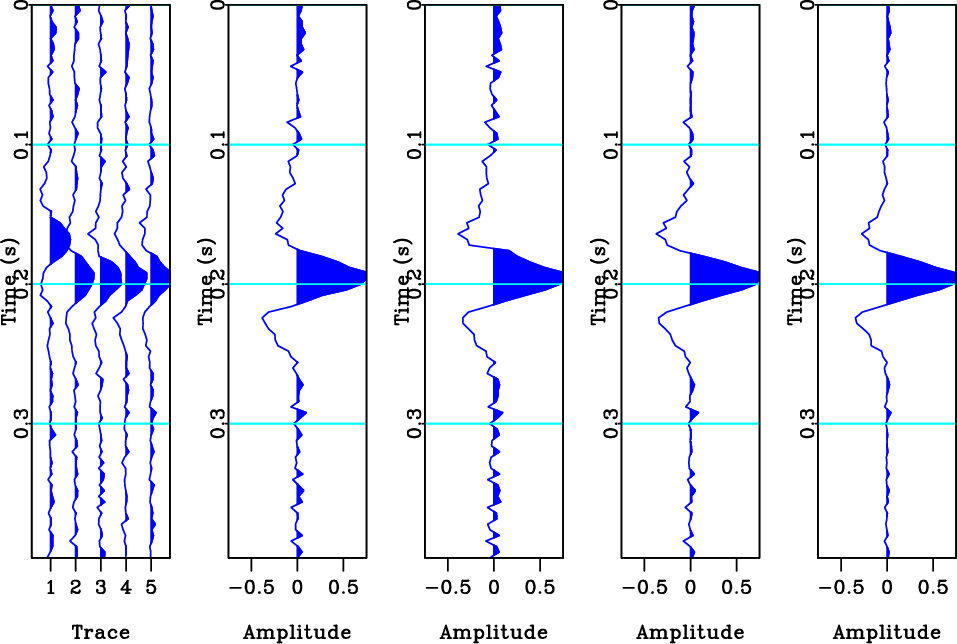
The second to fifth subfigures (from left to right) in Fig. 2 show the stacked traces using traditional stacking, smart stacking (Rashed, 2008), SNR stacking (Neelamani et al., 2006) and similarity weighted stacking (Liu et al., 2009), respectively. Despite the existence of the abnormal first trace, the similarity-weighted trace obtains the best stacking performance as shown in Liu et al. (2009). We zoom in the last figure in Fig. 2 and show it in the middle of Fig. 3. In addition, we show the clean signal on the left of Fig. 3 and the stacked signal using the proposed method on the right of Fig. 3. It is obvious that the abnormal trace makes the stacked trace based on local similarity deviate from the true signal a lot around 0.175s, as pointed out by the arrow. The proposed method, however, obtains a successful stacked signal. The SNR of the similarity based method is 8.85 dB and the SNR of the PCA based method is 9.38 dB. We can conclude from the synthetic example that the proposed method can not only help improve the SNR, but also can help better preserve the amplitude of the useful signals.
The number of stacking signals may be large, e.g., more than 50. The number of abnormal traces can also be larger than 1. Actually, when the number of stacking signals becomes larger, the method becomes more appealing, since more signals also implies more complicated signal features, more noise, and more abnormal traces. The superiority of the proposed method will become more practically beneficial when the data size and structure becomes more complicated, e.g., the field data example discussed next.
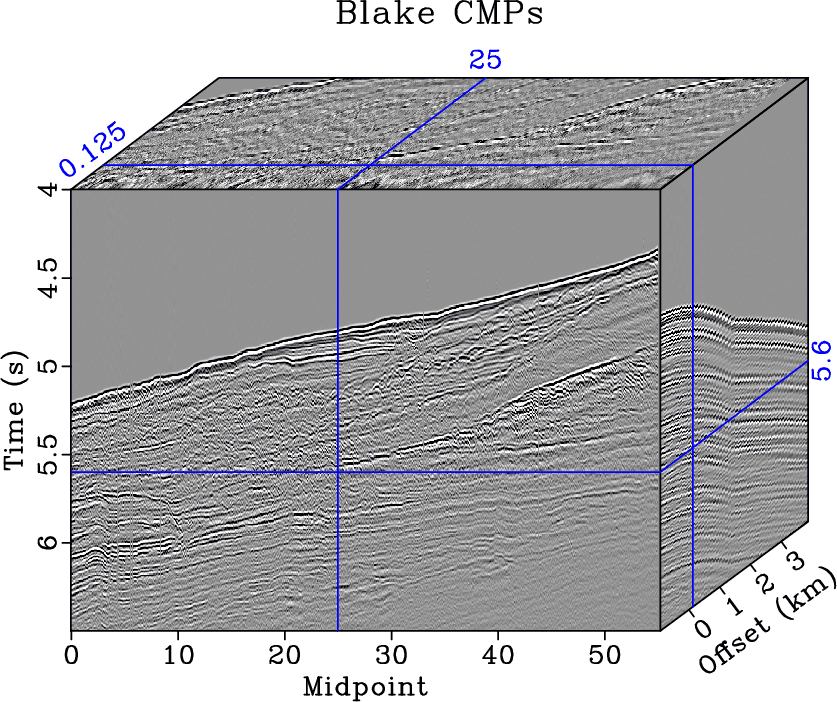
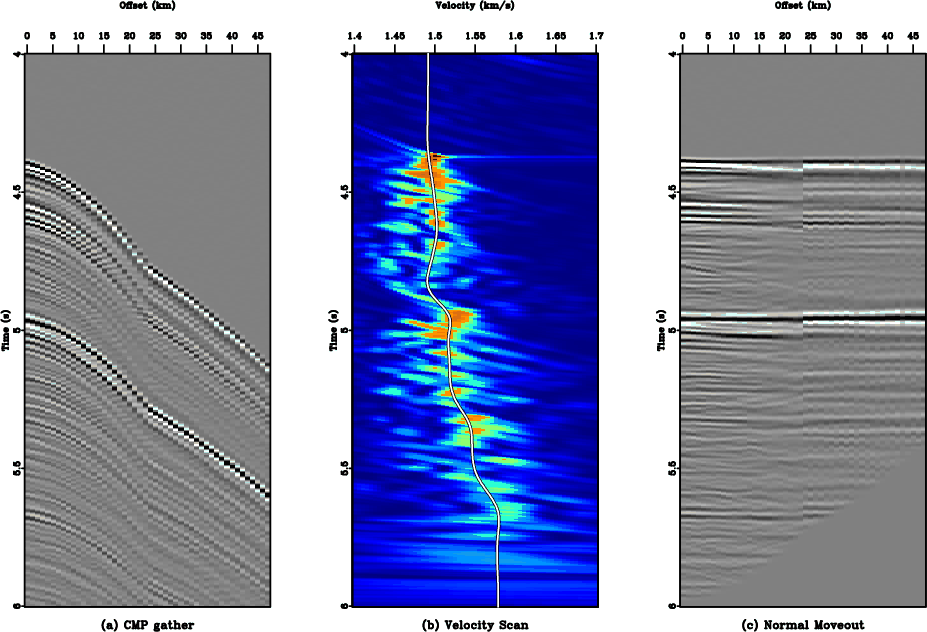
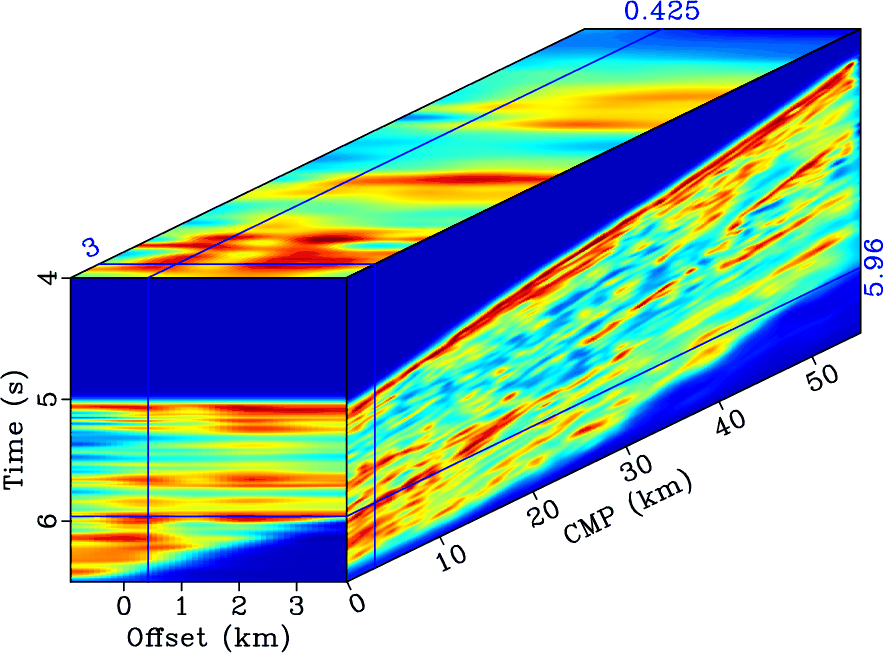
We then apply the proposed method to a field data example, as shown in Fig. 4. The second field data is a 2-D line from the Blake Outer Ridge area offshore Florida and Georgia. Fig. 5 shows a demonstration of flattening one CMP gather (Fig. 5a) using NMO velocity analysis (Fig. 5b) and NMO correction (Fig. 5c). The white line overlaying Fig. 5b denotes the automatically picked NMO velocity used for flattening the gather. Fig. 6 shows the weight calculated using the proposed method (equations 8 and 9). The stacked seismic images using different methods are shown in Fig. 7.
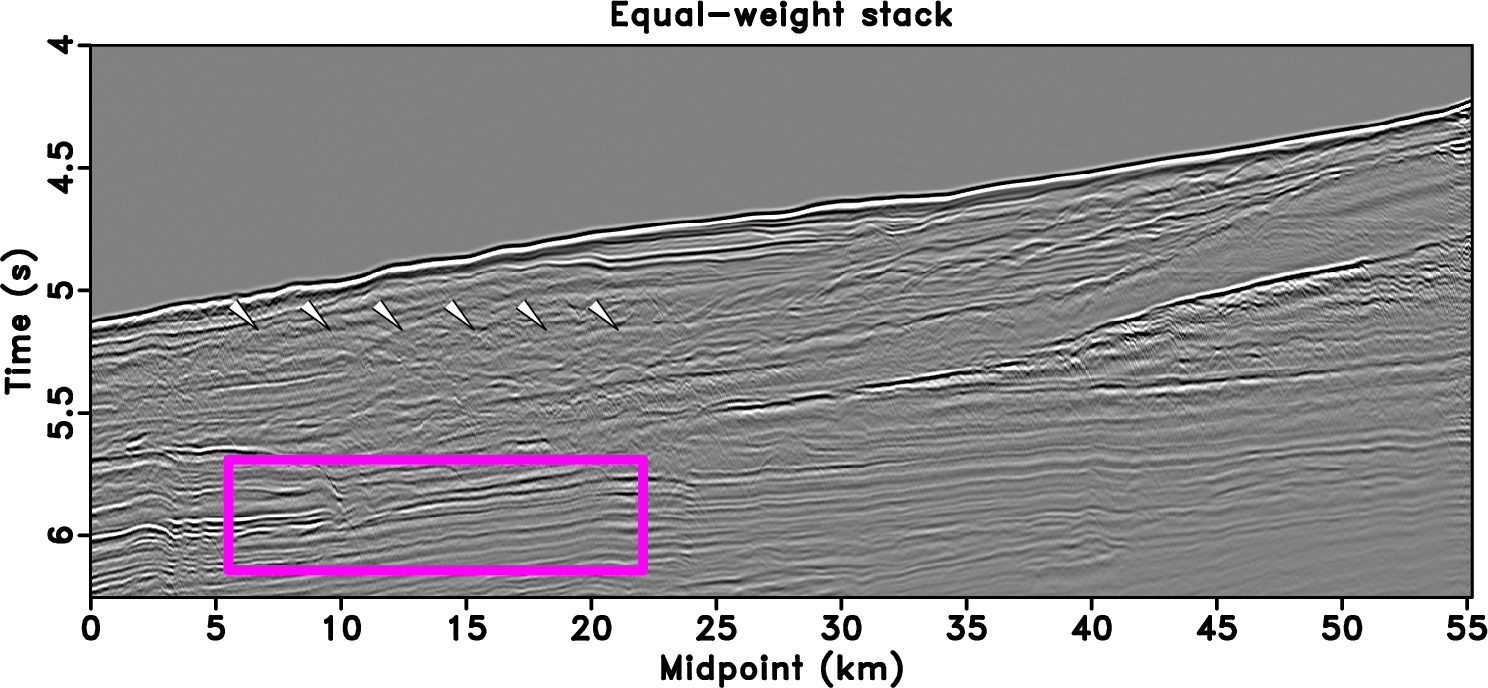
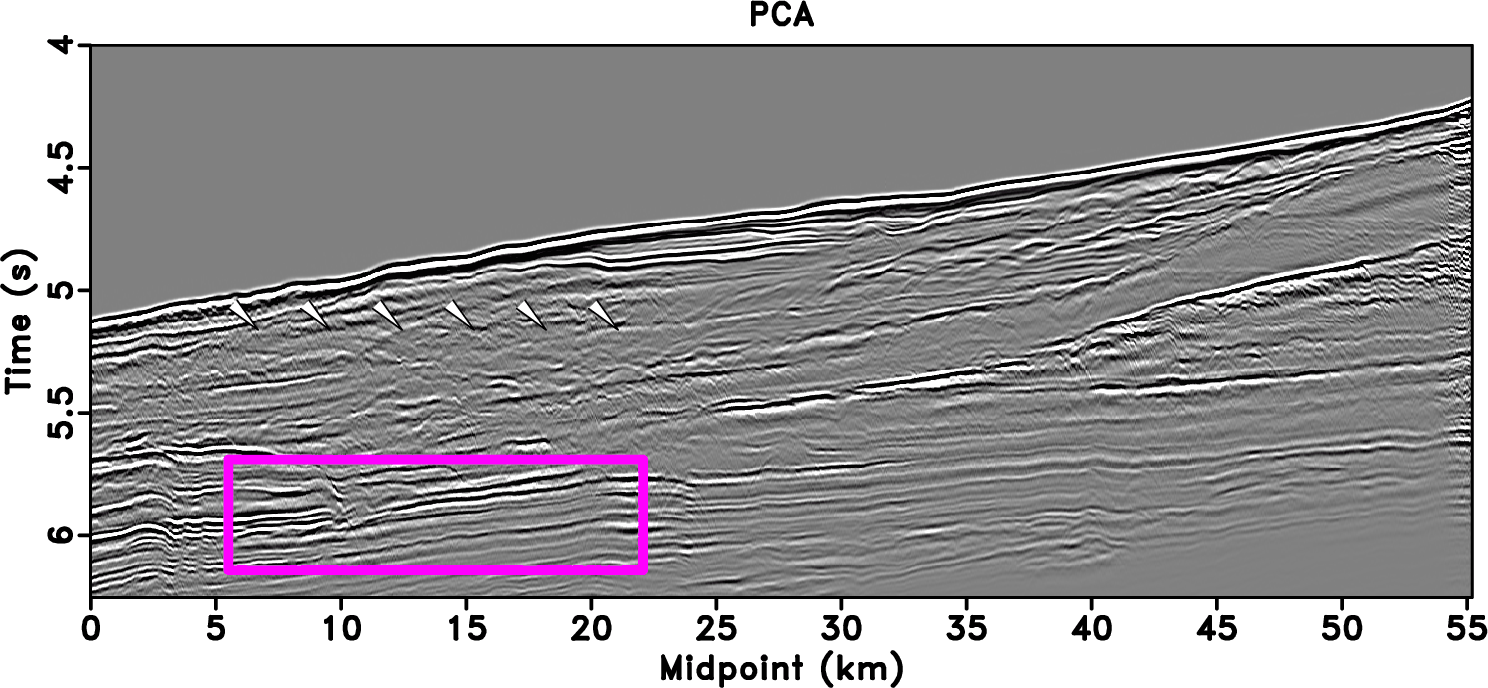
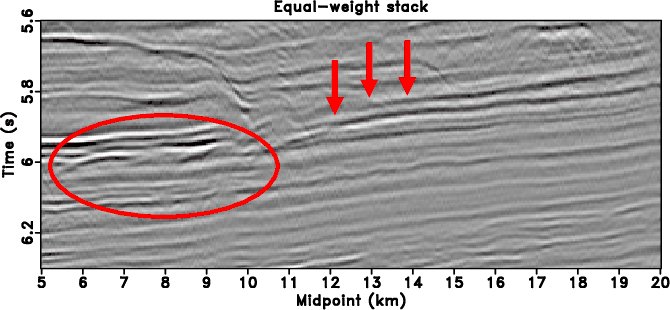
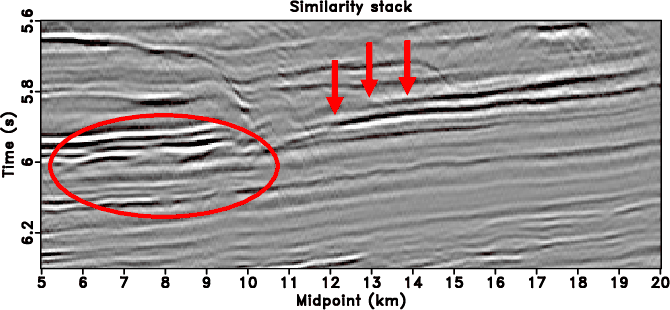
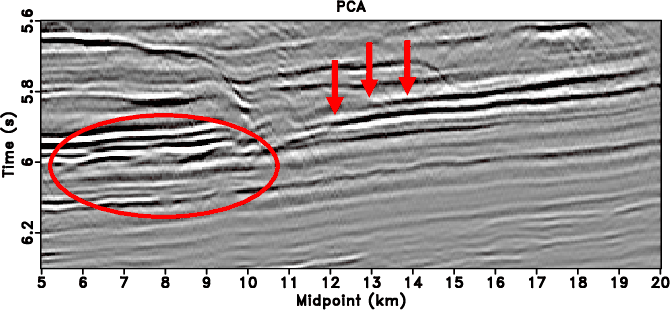
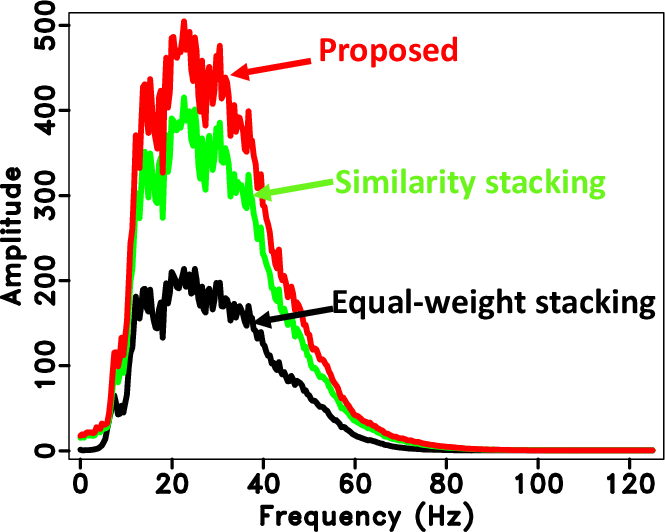
As shown in Fig. 7, the three sections (a),(b),(c) correspond to the stacked images of this field data example using three different methods: equal-weight stacking, similarity-weighted stacking, and PCA-based stacking. The proposed approach obtains a more satisfying stacking performance, as shown in Fig. 7c. The amplitude of seismic reflections becomes obviously stronger using the proposed approach (Fig. 7c). Fig. 8 shows zoomed sections that correspond to the pink frame boxes shown in Fig. 7. It further confirms that the proposed method can help obtain cleaner stacked image and better preserve the amplitude of the useful signals. In order to quantitatively compare the stacking performance of different methods, we plot the average spectrum (1D FFT along the time axis) of all the traces of the stacked images for three methods and show them in Fig. 9. The black line denotes the average spectrum of equal-weight stacking method. The green line corresponds to similarity stacking method. The red line corresponds to the proposed approach. It is very obvious that the energy of the proposed algorithm is stronger than that of the equal-weight stacking method and similarity stacking method, indicating that the proposed algorithm helps best preserve the amplitude of seismic reflection events. We also calculate the maximum frequency energy (MFE), i.e., the maximum amplitude of the average frequency spectrum, for three methods. MFE is 231.83 for the equal-weight method, 415.24 for the similarity method, and 504.77 for the proposed method. The proposed method improve the equal-weight method by 117.33% and improve the similarity method by 21.56% in terms of MFE.
It is worth mentioning that there is no 100% reliable way to compare the stacking performance of real seismic data in the literature, since there is no ground truth for real data. When judging the stacking performance by human observation, we care about the "large amplitude/energy" of those key reflectors since stronger amplitude/energy makes us see clearer the reflectors, as highlighted by the ellipses and arrows in Fig. 8. When interpreting the seismic profiles, the No 1 principle is to detect those critical reflectors, the No 2 principle is the coherency of those reflectors since it is related to the horizon tracking in seismic interpretation. The "accuracy" or "fidelity" of amplitude is not very important in interpretation of time-migrated seismic images. However, the modern seismic imaging techniques such as true-amplitude least-squares migration (Chen et al., 2017), seek to obtain true-amplitude subsurface image where the amplitude correctness is of vital importance. However, this is beyond the scope of the letter For judging the stacking performance of field data, we highly recommend to judge by "observing" and "interpreting".

|
|---|
|
syncomp
Figure 1. Left: Original NMO-corrected data. Right: Low-rank approximated data matrix. |
|
|
|
|---|
|
compare
Figure 2. From left to right: NMO-corrected data, conventional stack, smart stack (Rashed, 2008), SNR stack (Neelamani et al., 2006), and similarity stack (Liu et al., 2009). |
|
|

|
|---|
|
simi-combine
Figure 3. From left to right: true signal, stacked signal using the similarity-weighted stacking (SNR=8.85 dB), and stacked signal based on the PCA method SNR=9.38 dB. |
|
|
|
|---|
|
cmps
Figure 4. Field data example. |
|
|
|
|---|
|
nmo
Figure 5. Demonstration of NMO correction for the field data example. |
|
|
|
|---|
|
blake-weight
Figure 6. PCA-based weights for each time and space indices. |
|
|

|
|---|
|
blake-stack0,blake-simistack0,blake-simistack-tsvd0
Figure 7. (a) Stacked result using equal-weight method. (b) Stacked result using local similarity based weight. (c) Stacked result using the proposed method. |
|
|
|
|---|
|
zoom1,zoom2,zoom3
Figure 8. Zoomed sections from Fig. 7. (a) Stacked result using equal-weight method. (b) Stacked result using local similarity based weight. (c) Stacked result using the proposed method. |
|
|
|
|---|
|
field-fs
Figure 9. Comparisons of the average spectrum of all the traces. The black line denotes the average spectrum of equal-weight stacking method. The green line corresponds to similarity stacking method. The red line corresponds to the proposed approach. Note that energy of the proposed algorithm is obviously stronger than the other two methods. |
|
|
|
|
|
|
Application of principal component analysis in weighted stacking of seismic data |