|
|
|
|
Probing the subsurface karst features using time-frequency decomposition |
Next: Results Up: Chen: Probing the karst Previous: Method
|
|
|
|
Probing the subsurface karst features using time-frequency decomposition |
|
|---|
|
boons
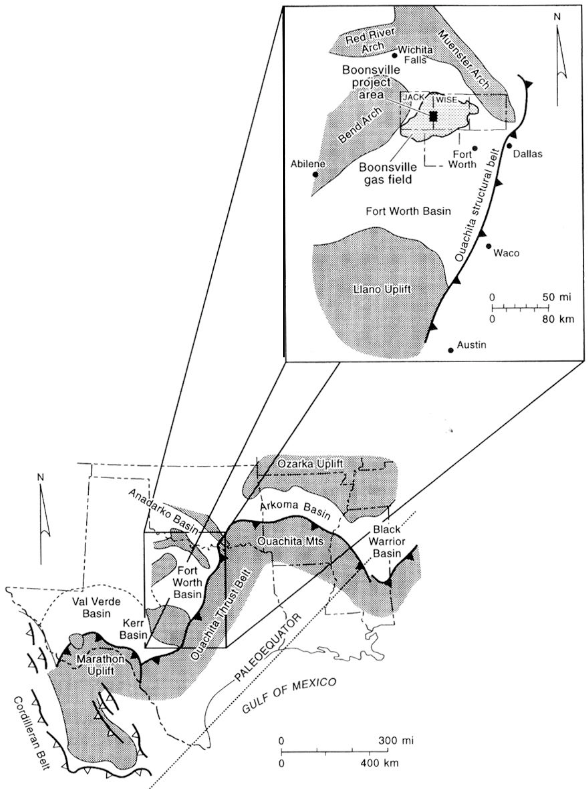
Figure 1. Middle Pennsylvanian paleogeographic map showing the Fort Worth Basin and other basins related to the Ouachita orogony and the Boonsville project area. The solid rectangle on the Wise-Jack county line designates the site of the 3-D seismic survey, curtersy of Hardage et al. (1996b). |
|
|
|
|---|
|
barnett-strat
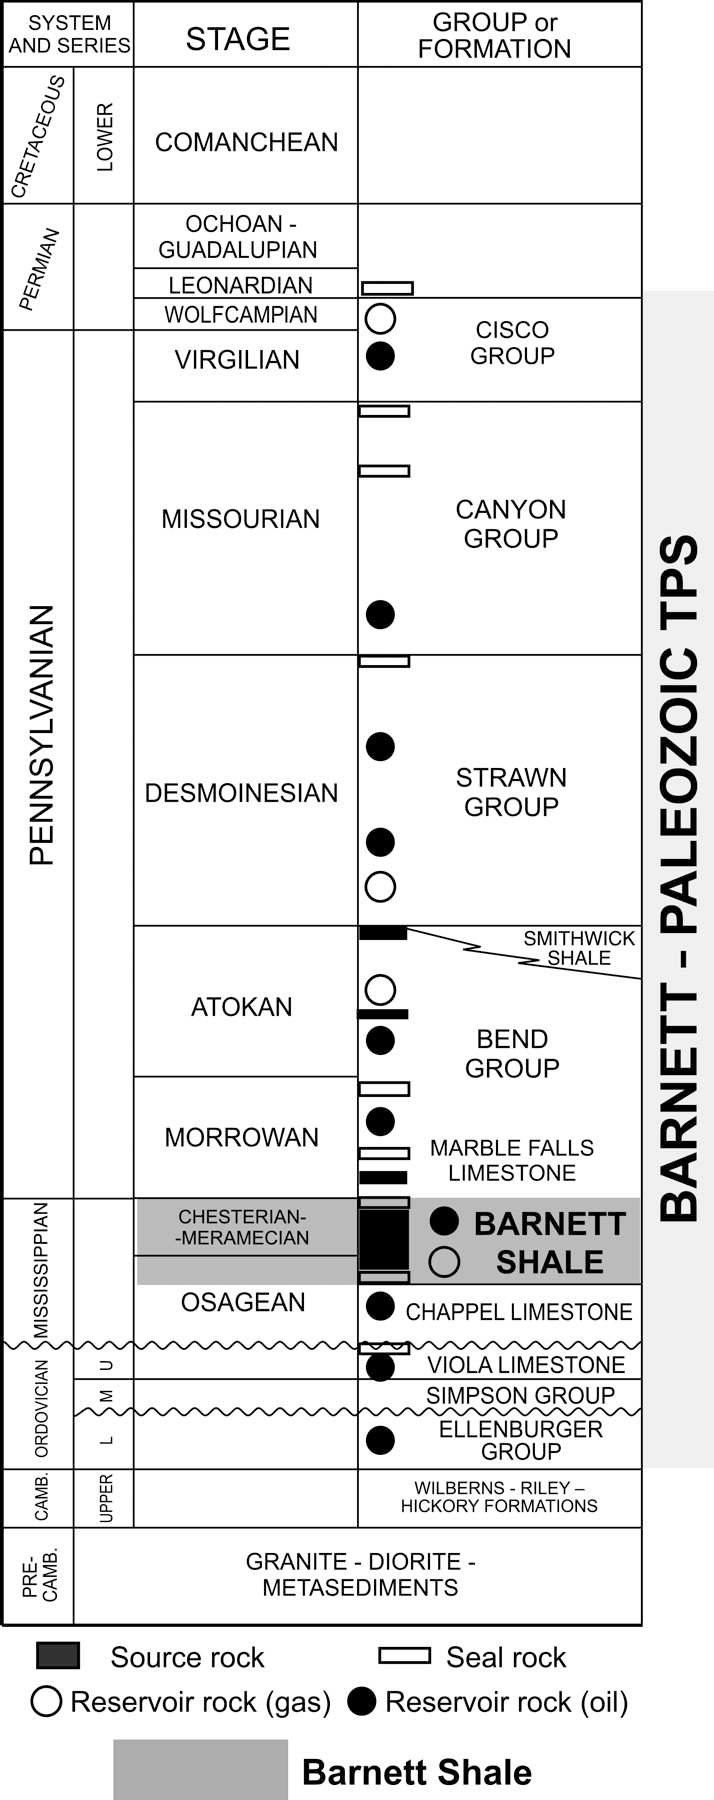
Figure 2. Strati-graphic column of the Fort Worth Basin, curtersy of Pollastro et al. (2007). The target horizon is the deep Ordovician-age Ellenburger carbonate section which causes numerous karst collapses and significant disruptions in the overlaying strata. |
|
|
|
|---|
|
old3d
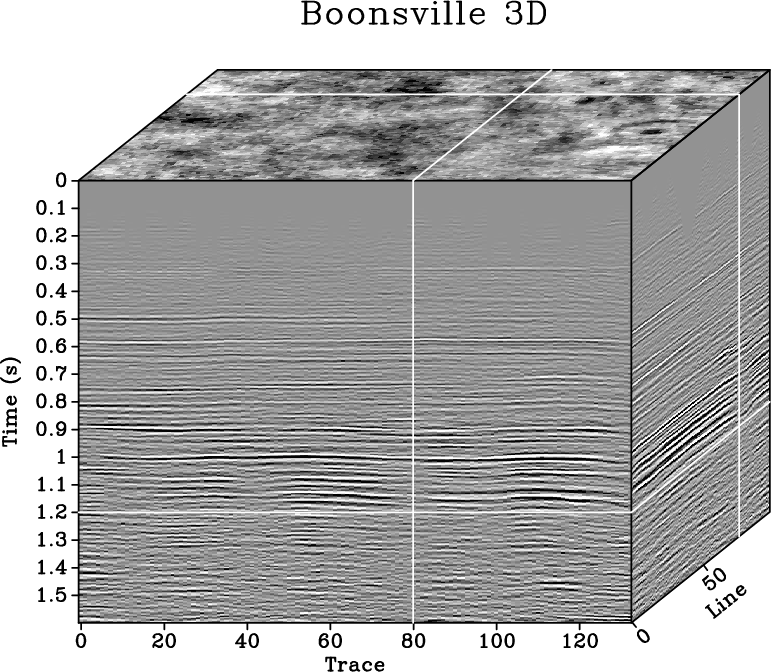
Figure 3. 3D Boonsville dataset after time migration. |
|
|
|
|---|
|
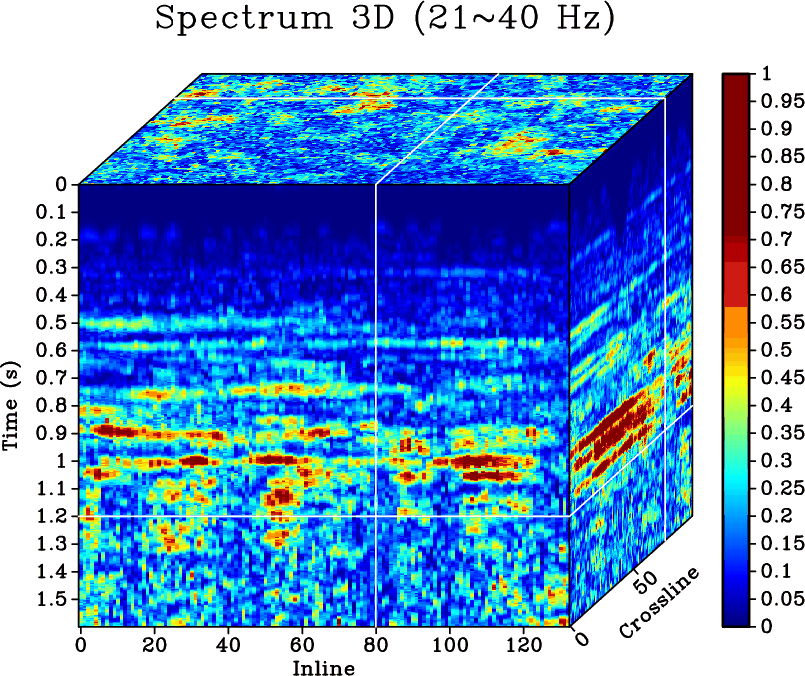
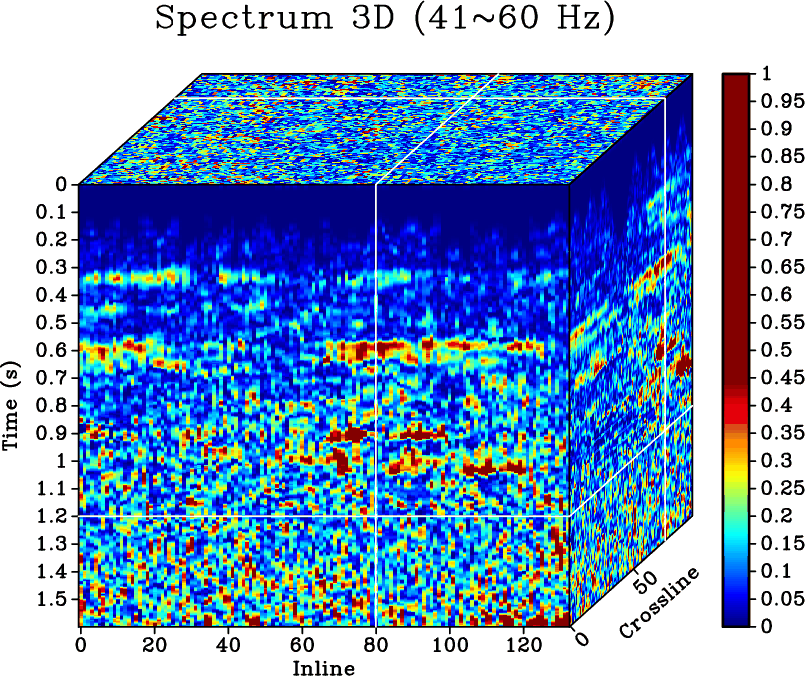
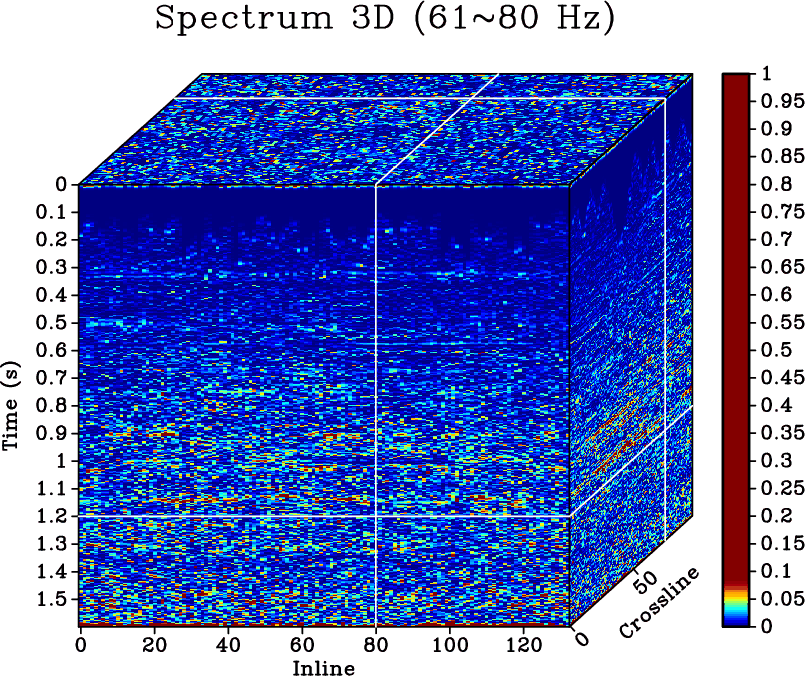
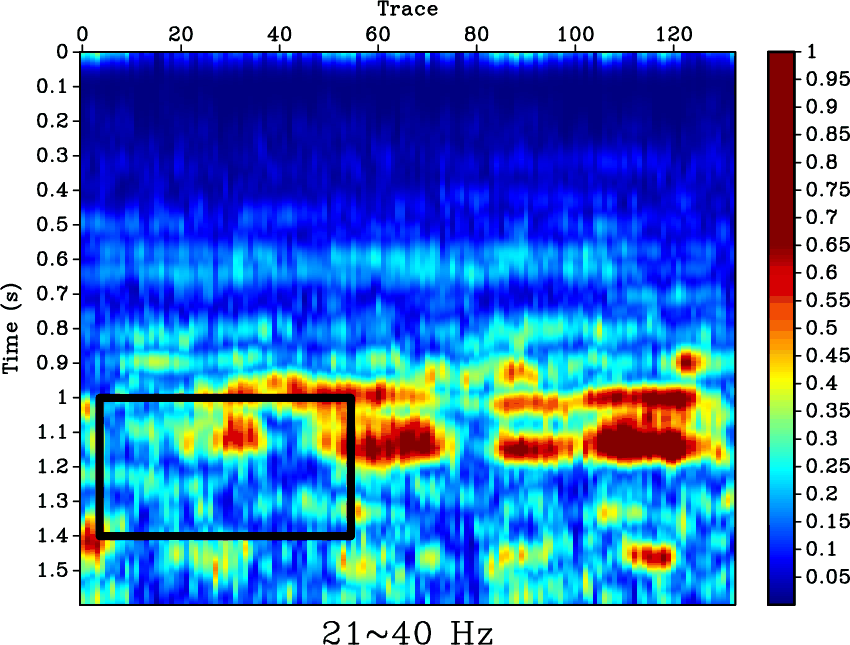
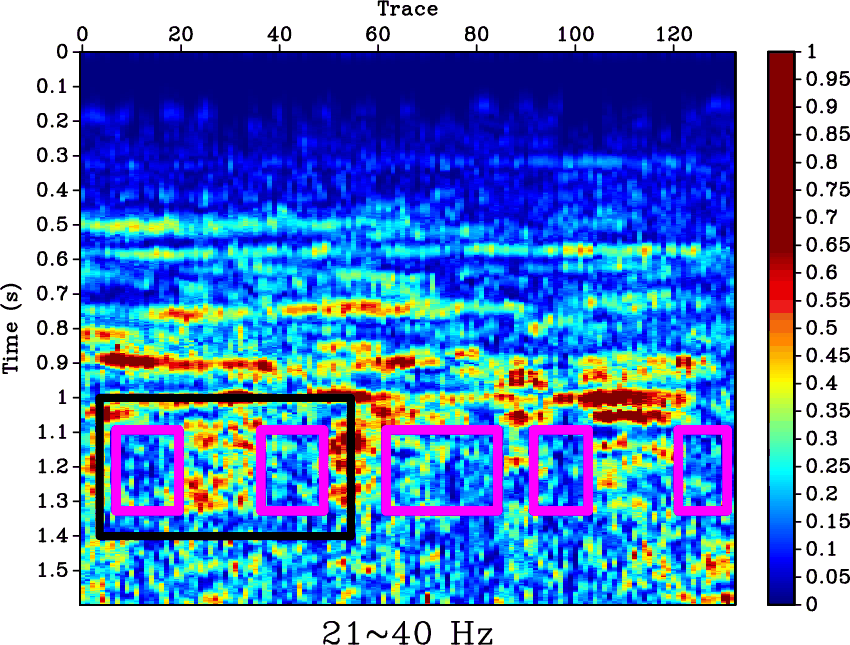
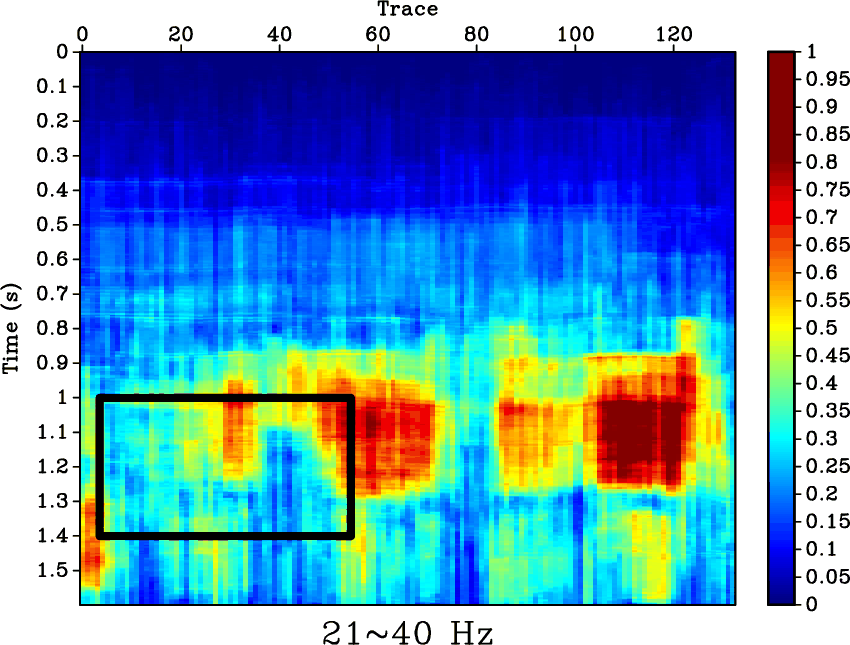
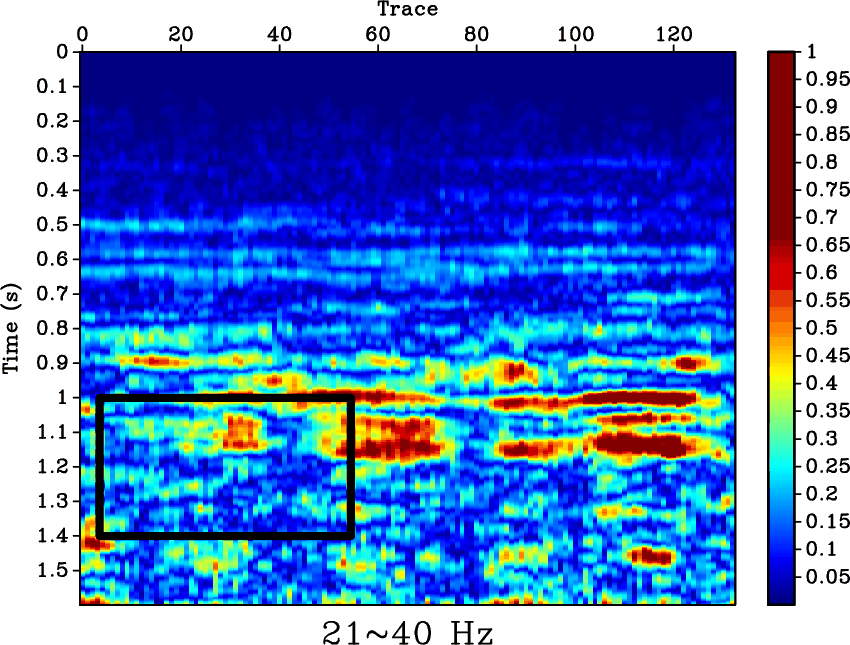
tfsswt1-2d3d-0,tfsswt2-2d3d-0,tfsswt3-2d3d-0,tfsswt4-2d3d-0
Figure 4. 3D karst features delineation result using SSWT with different frequency intervals. |
|
|
|
|---|
|
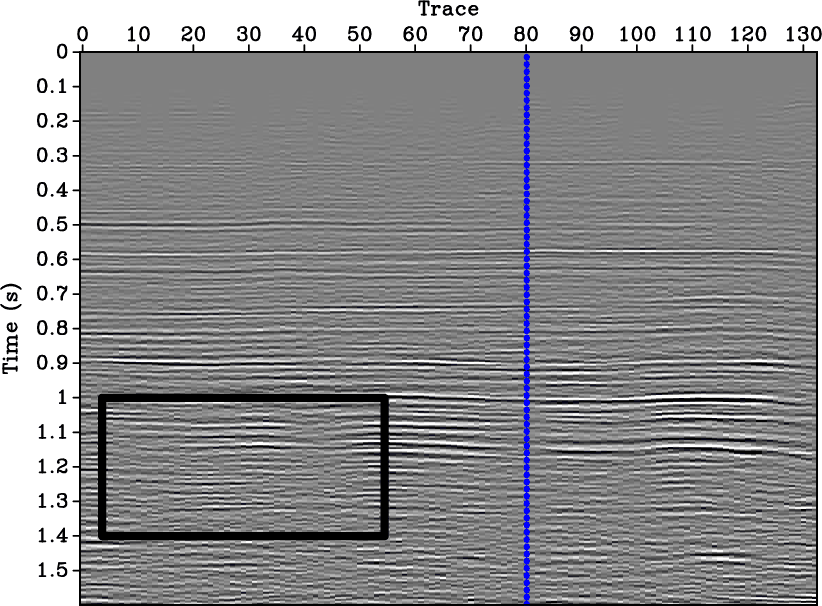
old,lowf-st,lowf-tfsswt2,lowf-stft,lowf-ltft
Figure 5. 2D seismic section (crossline=75) and its karst mapping results. (a) Amplitude section. (b) Low frequency slice of ST. (c) Low frequency slice of SSWT. (d) Low frequency slice of STFT. (e) Low frequency slice of LTFT. |
|
|
Some structure-related anomalies, such as the faults, discontinuities, karst collapses, are not always easily viewed from the original amplitude-based seismic profile. There are many approaches in the literature which better highlights the structural anomalies. One of the most common methods is to define a new seismic attribute which is sensitive to the structural anomalies (Xie et al., 2015b; Wang et al., 2015). The 3D dataset from the Boonsville field contains typical karst phenomenon, as shown in Figures 3 and 5a. But, from the original seismic reflections, the phenomenon is not obvious.
|
|
|
|
Probing the subsurface karst features using time-frequency decomposition |