|
|
|
|
Separation and imaging of seismic diffractions using a localized rank-reduction method with adaptively selected ranks |
Next: Field data tests Up: Comparison of Diffraction Imaging Previous: Comparison of Diffraction Imaging
|
|
|
|
Separation and imaging of seismic diffractions using a localized rank-reduction method with adaptively selected ranks |
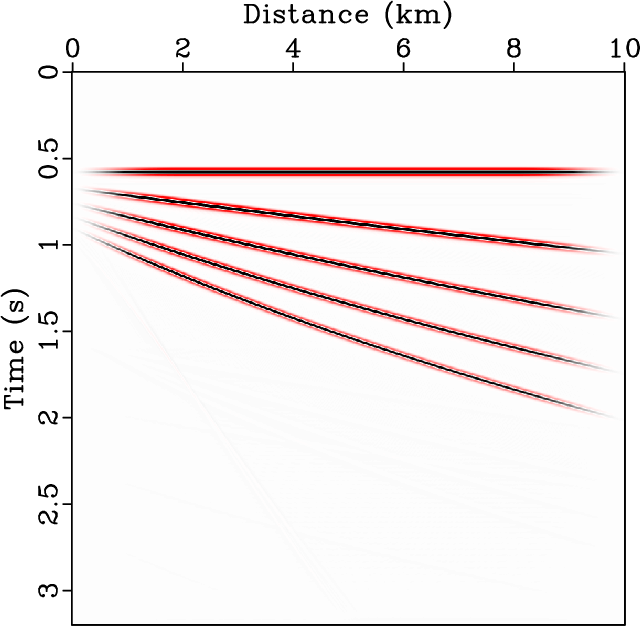
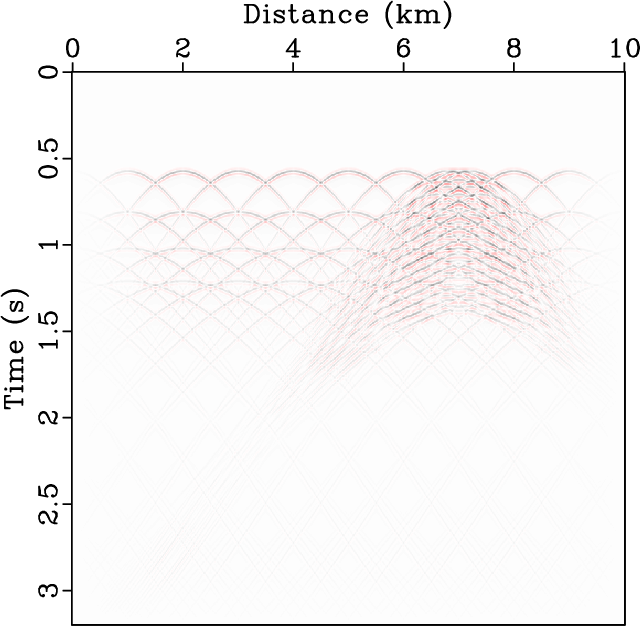
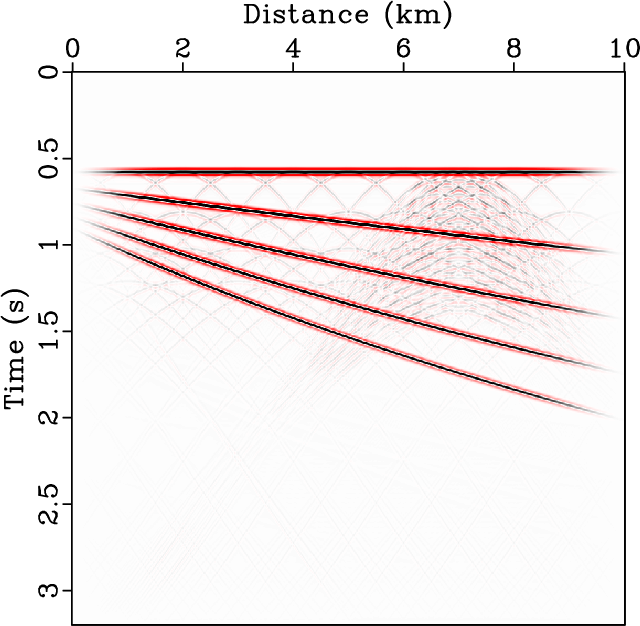
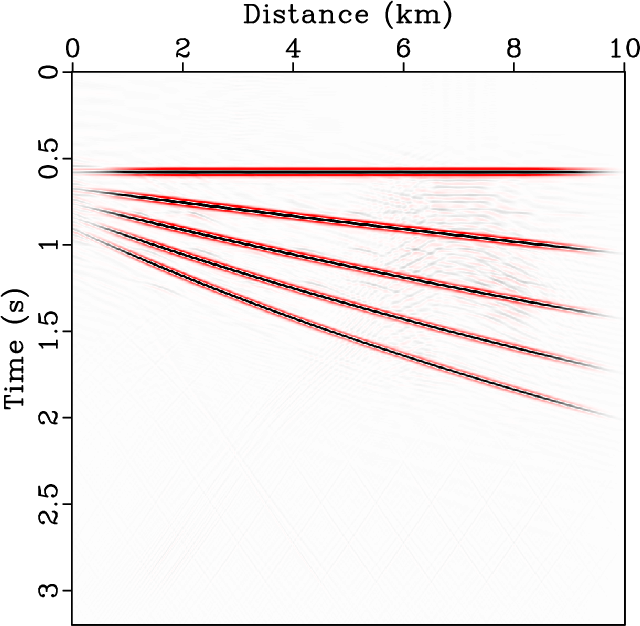
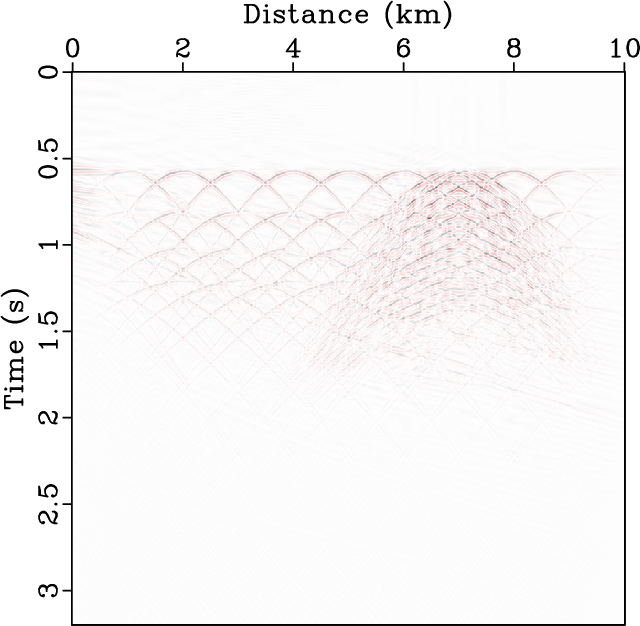
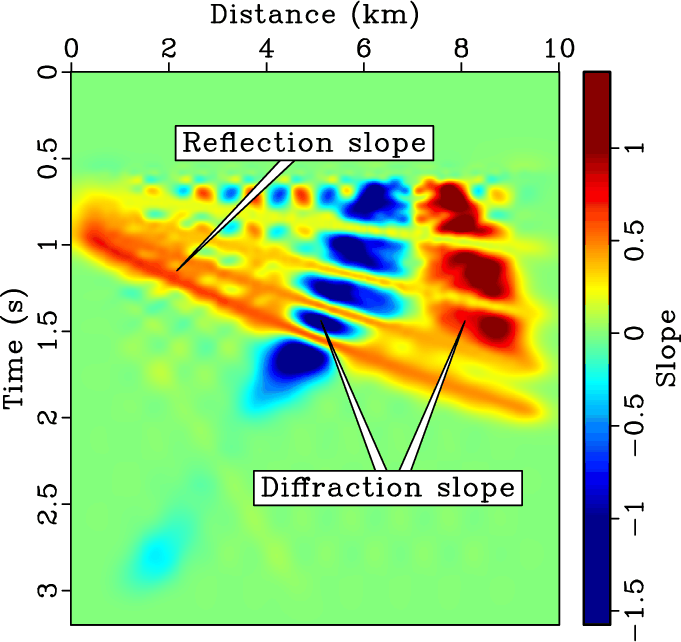
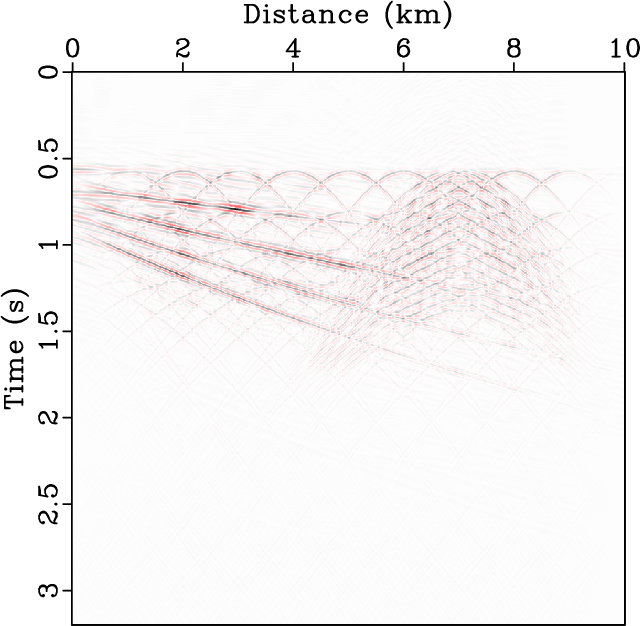
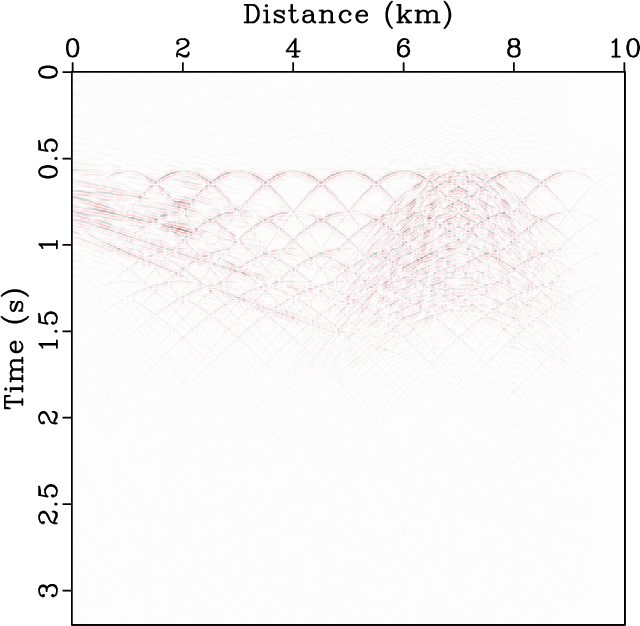
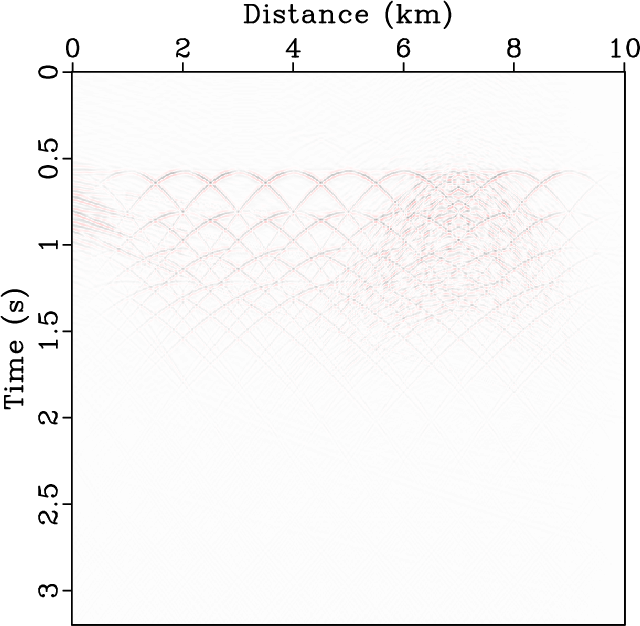
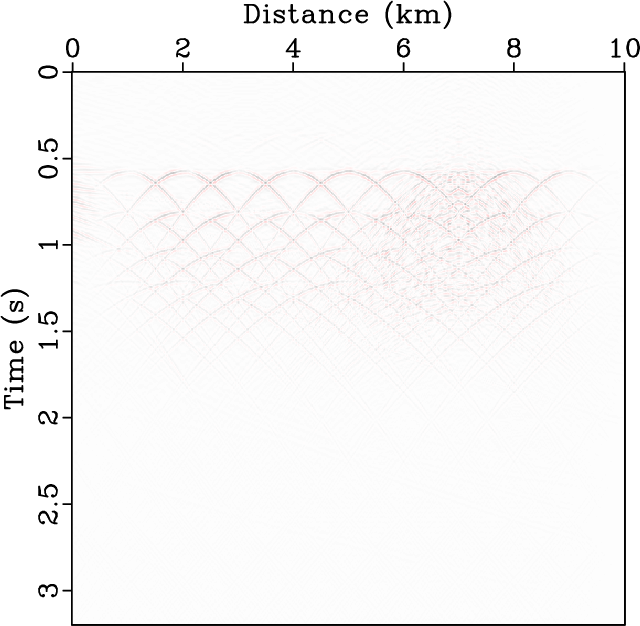
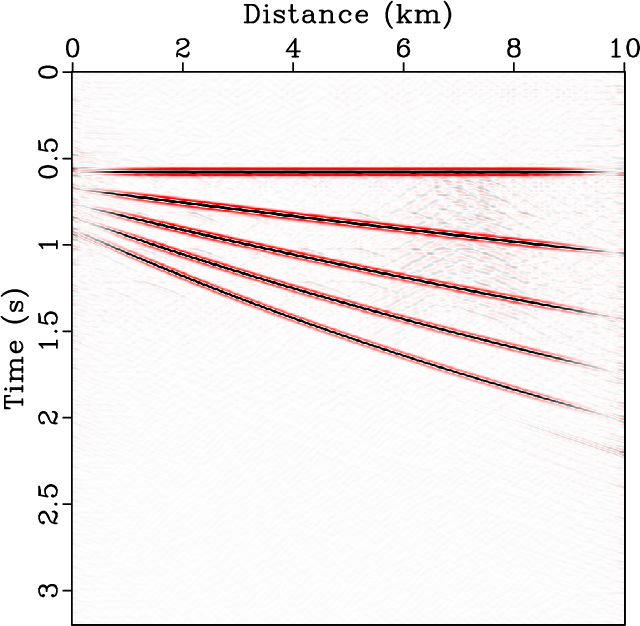
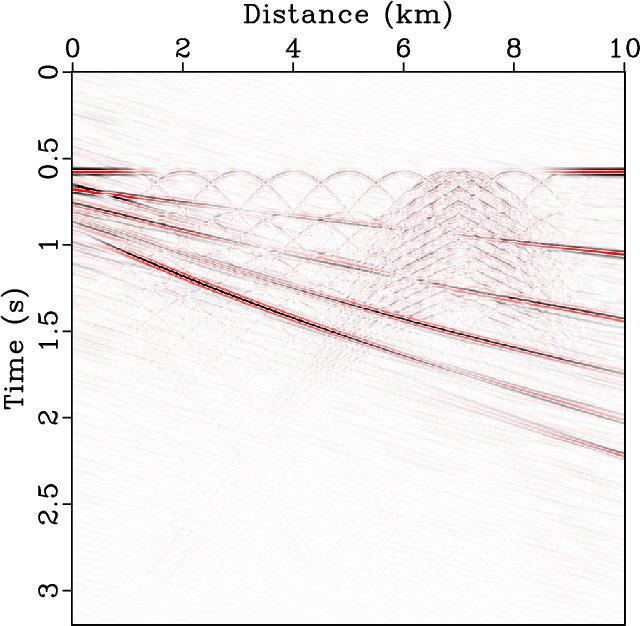
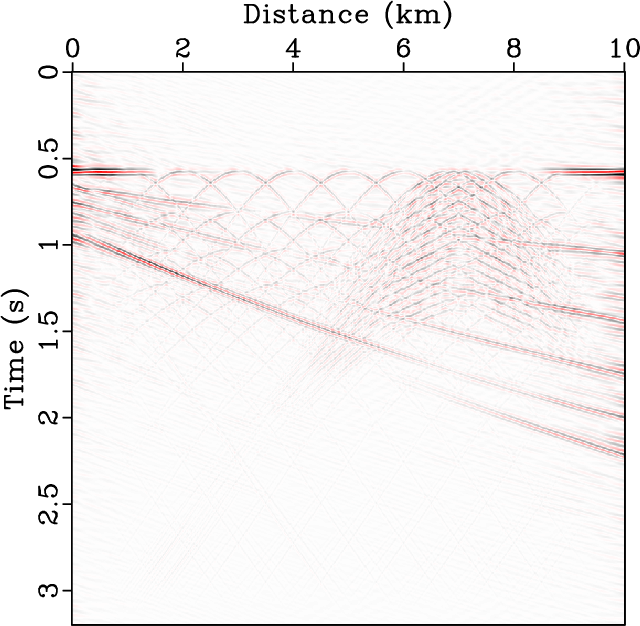
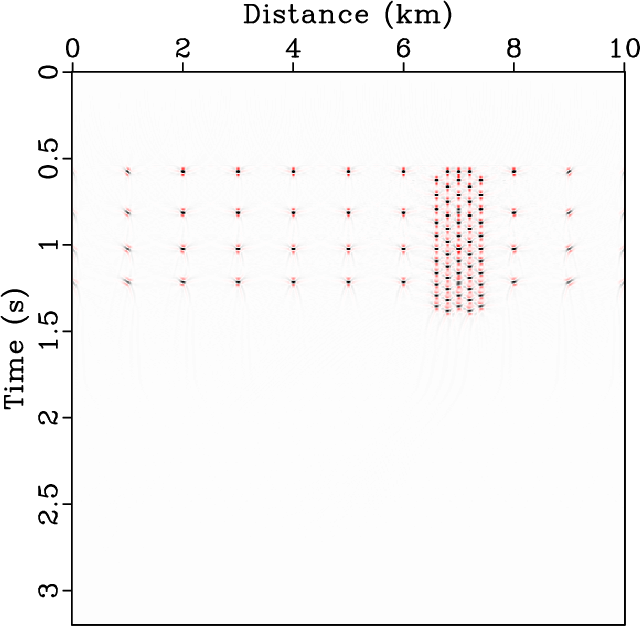
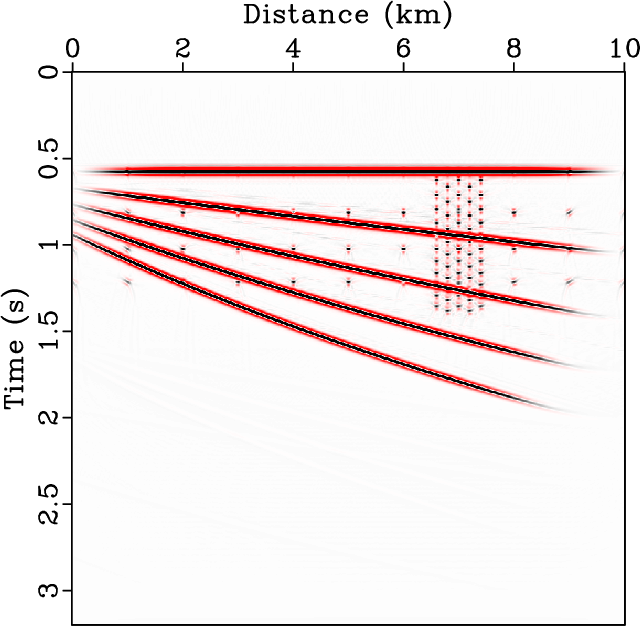
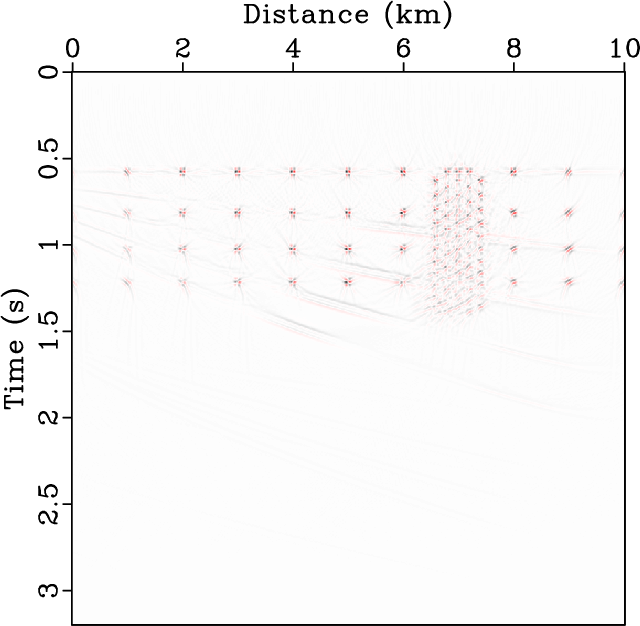
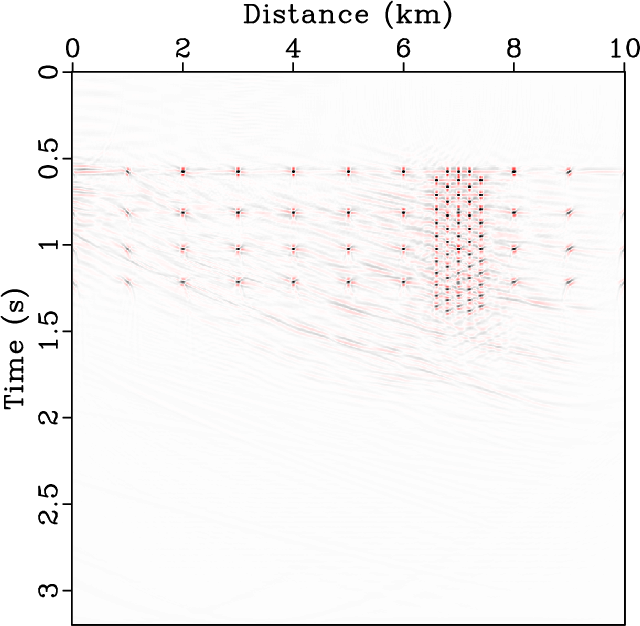
We first generate the reflection data from five reflection surfaces by Kirchhoff modeling (Figure 1a). Then, we generate the diffraction data from a set of diffraction points (Figure 1b). We sum the reflection and diffraction data to output the simulated zero-offset data (Figure 1c). The size of the zero-offset dataset is 800![]() 501. The temporal sampling is 4 ms and spatial sampling is 0.02 km. Note that the same synthetic data were also used in Merzlikin et al. (2019). We show the results from the PWD method (Fomel et al., 2007) and the proposed LRRA method in Figure 2. Figures 2a and 2c compare the separated reflectionswhile Figures 2b and 2d show the separated diffractions. It is clear that the PWD method (Figures 2a and 2b) causes significantly more residual diffractions in the separated reflections than the proposed LRRA method (Figures 2c and 2d). Correspondingly, the separated diffractions of the PWD method are much weaker than those from the proposed LRRA method. We attribute the unsatisfactory performance of the PWD method to the failure in distinguishing between the reflections and diffractions in the local slope map, as plotted in Figure 3. Because the slope estimation method calculates the slope for both reflections and diffractions, it is difficult to separate them for PWD diffraction separation method that relies on the slope difference. In this test, we use a local window with 200 samples in time and 100 samples in space. The window size is chosen so as to optimize the separability of diffractionsfrom reflections. Based on this criterion, we choose the optimal window size based on a try-and-error strategy in practice. We move the window by half of the window size in each directions, meaning that the overlap between two neighbor windows are 50%. We take the automatic rank selection strategy as introduced previously so we do not need to specify the rank parameter in the LRRA method. The PWD algorithm Fomel (2002b) in this paper is a local algorithm, but does not use local windows. Fomel (2002b) avoids the use of local window strategy by designing a non-stationary dip estimation method, where the window size is substituted by the smoothing radius. Thus the only parameter that affects the slope estimation is the smoothing radius (along time and space). A larger smoothing radius corresponds to a larger local window size, i.e., smoother, and vice versa. But the smoothing radius does not result in the same effect as the local window strategy. For example, when we increase the smoothing radius to a large level, the diffraction slope shown in Figure 3 will be weakened. But, at the same time, the accuracy of the reflection slope will deteriorate, thereby making the reflection not fully separated. In the opposite way, if the smoothing radius is smaller, like in this paper, the diffraction slope shows up, then the diffraction is not easy to be separated. So, this is the contradiction in tuning the PWD algorithm. In this paper, we use a smoothing radius of ten samples along both horizontal and vertical directions.
501. The temporal sampling is 4 ms and spatial sampling is 0.02 km. Note that the same synthetic data were also used in Merzlikin et al. (2019). We show the results from the PWD method (Fomel et al., 2007) and the proposed LRRA method in Figure 2. Figures 2a and 2c compare the separated reflectionswhile Figures 2b and 2d show the separated diffractions. It is clear that the PWD method (Figures 2a and 2b) causes significantly more residual diffractions in the separated reflections than the proposed LRRA method (Figures 2c and 2d). Correspondingly, the separated diffractions of the PWD method are much weaker than those from the proposed LRRA method. We attribute the unsatisfactory performance of the PWD method to the failure in distinguishing between the reflections and diffractions in the local slope map, as plotted in Figure 3. Because the slope estimation method calculates the slope for both reflections and diffractions, it is difficult to separate them for PWD diffraction separation method that relies on the slope difference. In this test, we use a local window with 200 samples in time and 100 samples in space. The window size is chosen so as to optimize the separability of diffractionsfrom reflections. Based on this criterion, we choose the optimal window size based on a try-and-error strategy in practice. We move the window by half of the window size in each directions, meaning that the overlap between two neighbor windows are 50%. We take the automatic rank selection strategy as introduced previously so we do not need to specify the rank parameter in the LRRA method. The PWD algorithm Fomel (2002b) in this paper is a local algorithm, but does not use local windows. Fomel (2002b) avoids the use of local window strategy by designing a non-stationary dip estimation method, where the window size is substituted by the smoothing radius. Thus the only parameter that affects the slope estimation is the smoothing radius (along time and space). A larger smoothing radius corresponds to a larger local window size, i.e., smoother, and vice versa. But the smoothing radius does not result in the same effect as the local window strategy. For example, when we increase the smoothing radius to a large level, the diffraction slope shown in Figure 3 will be weakened. But, at the same time, the accuracy of the reflection slope will deteriorate, thereby making the reflection not fully separated. In the opposite way, if the smoothing radius is smaller, like in this paper, the diffraction slope shows up, then the diffraction is not easy to be separated. So, this is the contradiction in tuning the PWD algorithm. In this paper, we use a smoothing radius of ten samples along both horizontal and vertical directions.
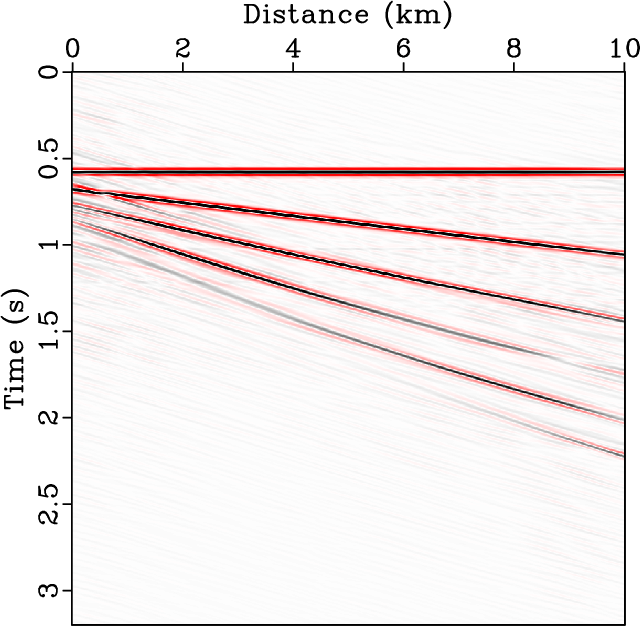
To compare the performance of the automatic rank selection strategy and manual rank selection strategy, we perform several try-and-error tests by specifying different ranks based on the LRR method. Figure 4a-4d shows four separated reflection sections based on the LRR method with a fixed rank of
![]() , respectively. Correspondingly, Figure 5a-5d shows four separated diffraction sections based on the LRR method with the same fixed rank as Figure 4. From Figures 4 and 5, we can find that the residual diffraction energy in the separated reflection sections gradually increases, and the reflection energy in the separated diffraction sections decreases, as the fixed rank increases from
, respectively. Correspondingly, Figure 5a-5d shows four separated diffraction sections based on the LRR method with the same fixed rank as Figure 4. From Figures 4 and 5, we can find that the residual diffraction energy in the separated reflection sections gradually increases, and the reflection energy in the separated diffraction sections decreases, as the fixed rank increases from ![]() to
to ![]() . All these results from the LRR method with fixed ranks appear worse than the result from the LRRA method. For example, when
. All these results from the LRR method with fixed ranks appear worse than the result from the LRRA method. For example, when ![]() , the separated reflection section (Figure 4a) is clean and free of diffraction, but the separated diffraction contains very strong reflection energy, which will significantly deteriorate the resolution of migrated diffractors in the diffraction image. When
, the separated reflection section (Figure 4a) is clean and free of diffraction, but the separated diffraction contains very strong reflection energy, which will significantly deteriorate the resolution of migrated diffractors in the diffraction image. When ![]() (Figure 4d), the separated diffraction section contains pure diffraction energy, but the associated reflection section contains significant diffraction energy, thus the resulted diffraction image will not be accurate. When
(Figure 4d), the separated diffraction section contains pure diffraction energy, but the associated reflection section contains significant diffraction energy, thus the resulted diffraction image will not be accurate. When ![]() and
and ![]() , it seems that the LRR method obtains a better compromise, but is less powerful in removing the diffractions than the LRRA method. The worse performance of the LRR method with a fixed rank compared with the LRRA method with automatically selected ranks is due to the rank inconsistency problem (Zu et al., 2017), i.e., the optimal ranks in each localized processing window are different and thus a globally defined rank cannot suit each localized window. In addition to the superior perfomance, LRRA method also avoids the try-and-error process for rank selection and is more convenient to apply.
, it seems that the LRR method obtains a better compromise, but is less powerful in removing the diffractions than the LRRA method. The worse performance of the LRR method with a fixed rank compared with the LRRA method with automatically selected ranks is due to the rank inconsistency problem (Zu et al., 2017), i.e., the optimal ranks in each localized processing window are different and thus a globally defined rank cannot suit each localized window. In addition to the superior perfomance, LRRA method also avoids the try-and-error process for rank selection and is more convenient to apply.
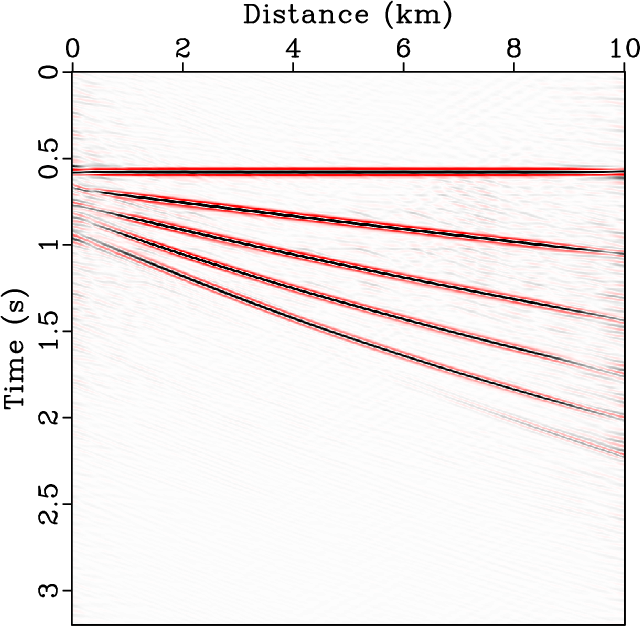
We also compare the performance of diffraction separation based on a global rank reduction (GRR) method (Lin et al., 2020; Oropeza and Sacchi, 2011; Chen et al., 2016) with different rank choices. Figures 6a-6d show a comparison of separated reflection sections using the GRR method with a fixed rank of
![]() , respectively. Figure 7 shows a comparison of separated diffraction sections using the GRR method with the same fixed ranks as Figure 6. From Figures 6 and 7, it is evident that as the rank increases, the residual diffraction energy in the separated reflection sections reduces while the diffraction sections become cleaner and cleaner in the sense of less reflection energy. The general performance of the GRR method is similar to that of the LRR method, but it is more difficult to compromise between the cleanness and preservation of the reflection energy for the GRR method. For example, when the separated reflection section (Figure 6d) contains the same level of residual diffraction energy as the LRR method (Figure 4d), its diffraction section contains stronger reflection energy. The GRR method tends to fail because of the non-stationarity of both reflection and diffraction energy, while the GRR method is based on a global linear-event assumption (Oropeza and Sacchi, 2011). To verify the diffraction imaging performance of the better separated diffractions using the proposed LRRA method, we plot four different diffraction images in Figure 8. Figure 8a shows a ground-truth diffraction image as a reference. Figure 8b shows the migrated image of the zero-offset dataset (Figure 1c), i.e., treating both reflections and diffractions as a whole and without special handling of the diffraction energy. Figure 8b is considered as a conventional image as compared with the more advanced diffraction image. Figure 8c shows the migrated image of the separated diffractions from the PWD method, where most diffraction points are imaged well but with some blurry points at greater depths. Figure 8d shows the diffraction image using the proposed method, where all diffraction points are imaged clearly. Besides, because the separated diffraction energy of the proposed method is stronger than that of the PWD method, the resulted image has an obviously stronger amplitude of each diffraction point.
, respectively. Figure 7 shows a comparison of separated diffraction sections using the GRR method with the same fixed ranks as Figure 6. From Figures 6 and 7, it is evident that as the rank increases, the residual diffraction energy in the separated reflection sections reduces while the diffraction sections become cleaner and cleaner in the sense of less reflection energy. The general performance of the GRR method is similar to that of the LRR method, but it is more difficult to compromise between the cleanness and preservation of the reflection energy for the GRR method. For example, when the separated reflection section (Figure 6d) contains the same level of residual diffraction energy as the LRR method (Figure 4d), its diffraction section contains stronger reflection energy. The GRR method tends to fail because of the non-stationarity of both reflection and diffraction energy, while the GRR method is based on a global linear-event assumption (Oropeza and Sacchi, 2011). To verify the diffraction imaging performance of the better separated diffractions using the proposed LRRA method, we plot four different diffraction images in Figure 8. Figure 8a shows a ground-truth diffraction image as a reference. Figure 8b shows the migrated image of the zero-offset dataset (Figure 1c), i.e., treating both reflections and diffractions as a whole and without special handling of the diffraction energy. Figure 8b is considered as a conventional image as compared with the more advanced diffraction image. Figure 8c shows the migrated image of the separated diffractions from the PWD method, where most diffraction points are imaged well but with some blurry points at greater depths. Figure 8d shows the diffraction image using the proposed method, where all diffraction points are imaged clearly. Besides, because the separated diffraction energy of the proposed method is stronger than that of the PWD method, the resulted image has an obviously stronger amplitude of each diffraction point.
|
|---|
|
s-datai,s-diffr,s-data
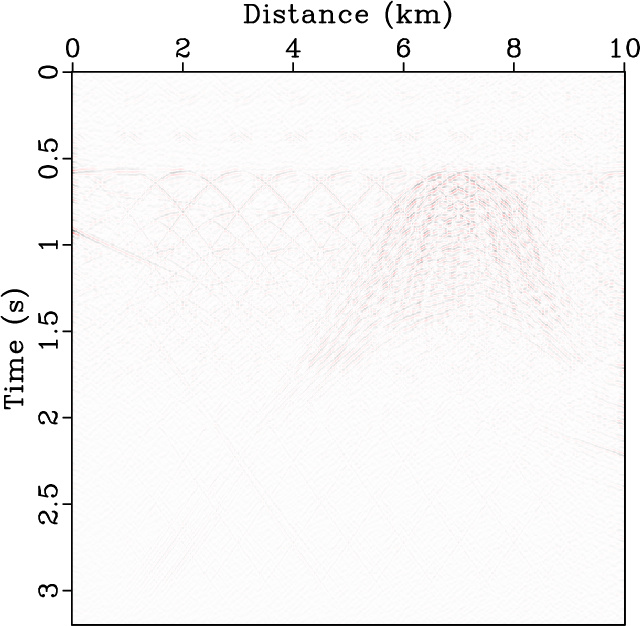
Figure 1. (a) Simulated reflection data. (b) Simulated diffraction data. (c) Simulated zero-offset data containing both reflections and diffractions. |
|
|


|
|---|
|
s-pwd-s,s-pwd-n,s-lrra-s,s-lrra-n
Figure 2. (a) Separated reflections using PWD method. (b) Separated diffractions using PWD method. (c) Separated reflections using LRRA method. (d) Separated diffractions using LRRA method. |
|
|
|
|---|
|
s-dip0
Figure 3. Estimated local slope from the zero-offset data shown in Figure 1c, which is used for PWD analysis. Note that both reflection and diffraction slopes are revealed in this map. |
|
|


|
|---|
|
s-lrr-N2-s,s-lrr-N3-s,s-lrr-N4-s,s-lrr-N5-s
Figure 4. Separated reflections using LRR method with (a) N=2, (b) N=3, (c) N=4, (d) N=5. |
|
|
|
|---|
|
s-lrr-N2-n,s-lrr-N3-n,s-lrr-N4-n,s-lrr-N5-n
Figure 5. Separated diffractions using LRR method with (a) N=2, (b) N=3, (c) N=4, (d) N=5. |
|
|

|
|---|
|
s-grr-N5-s,s-grr-N10-s,s-grr-N16-s,s-grr-N25-s
Figure 6. Separated reflections using GRR method with (a) N=5, (b) N=10, (c) N=16, (d) N=25. |
|
|

|
|---|
|
s-grr-N5-n,s-grr-N10-n,s-grr-N16-n,s-grr-N25-n
Figure 7. Separated diffractions using GRR method with (a) N=5, (b) N=10, (c) N=16, (d) N=25. |
|
|
|
|---|
|
s-mig-true,s-mig0,s-mig-tra,s-mig
Figure 8. True diffraction image (a) and migration results of (b) traditional method, (c) PWD method, and (d) LRRA method. |
|
|
|
|
|
|
Separation and imaging of seismic diffractions using a localized rank-reduction method with adaptively selected ranks |