|
|
|
|
Separation and imaging of seismic diffractions using a localized rank-reduction method with adaptively selected ranks |
Next: Conclusions Up: Comparison of Diffraction Imaging Previous: Synthetic test
|
|
|
|
Separation and imaging of seismic diffractions using a localized rank-reduction method with adaptively selected ranks |
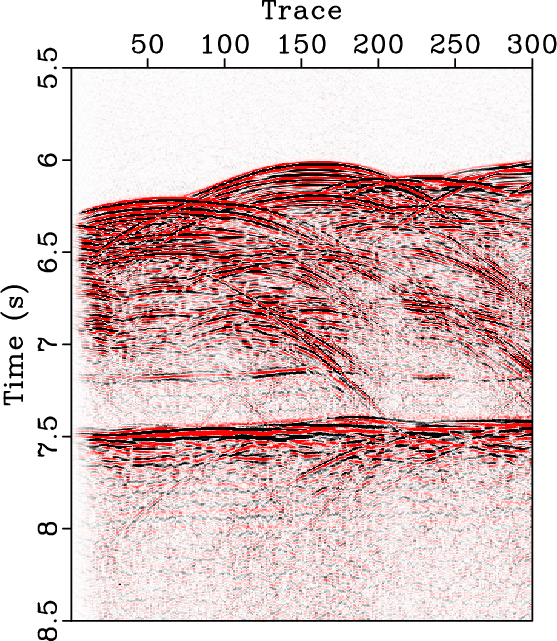
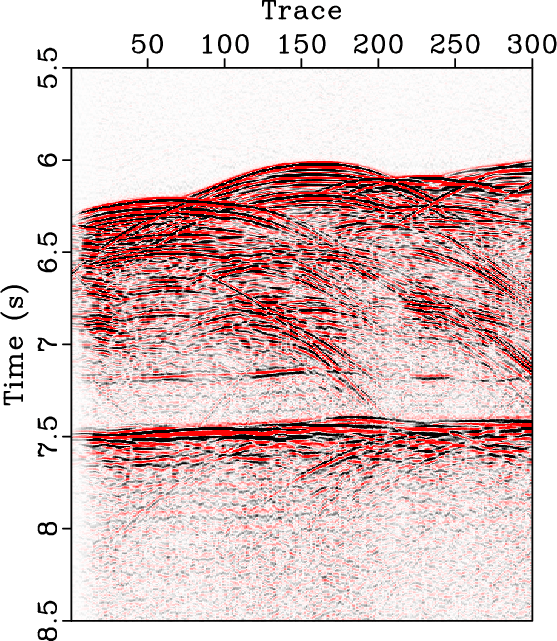
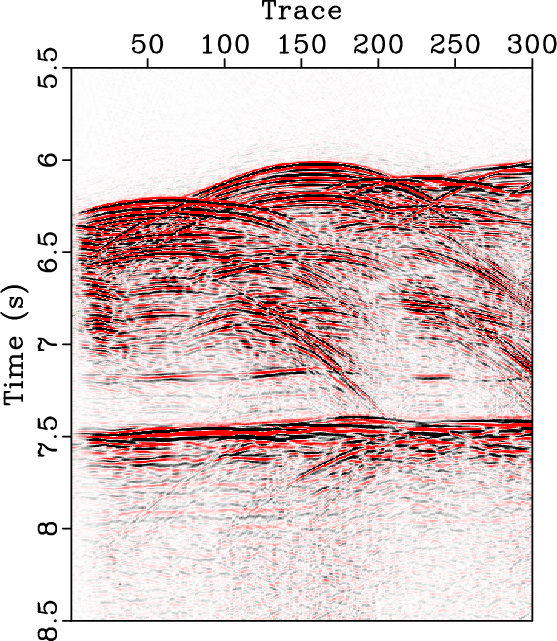
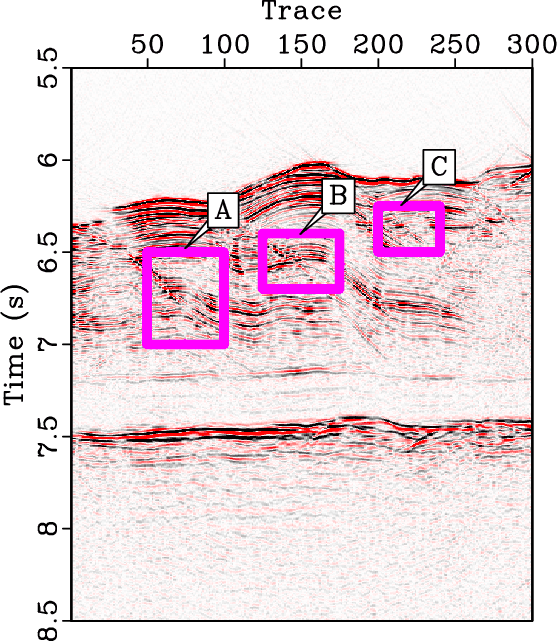
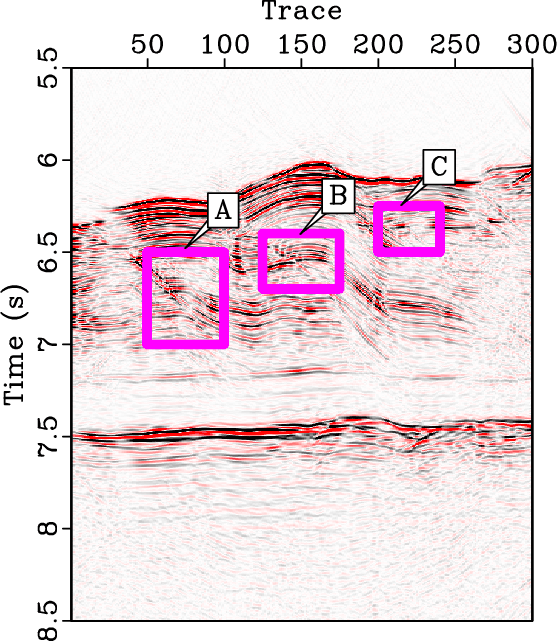
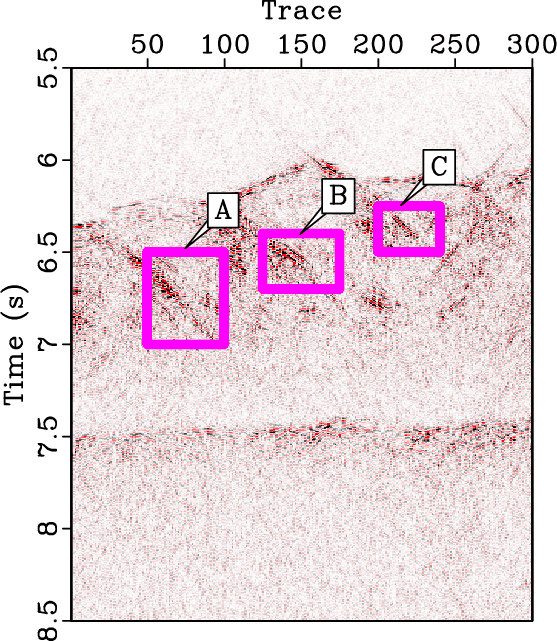
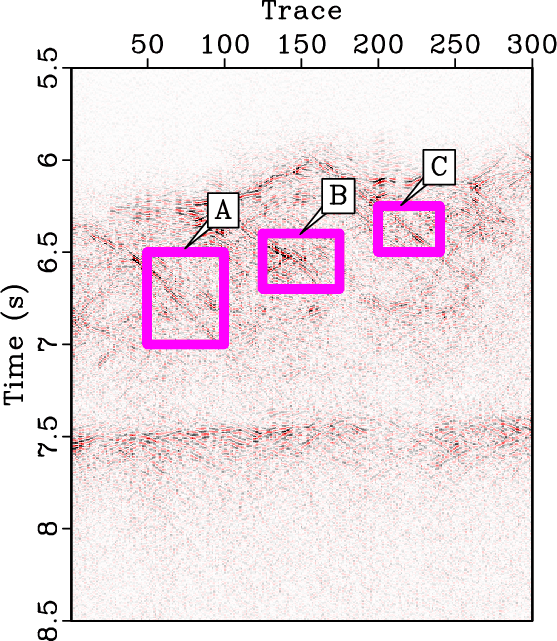
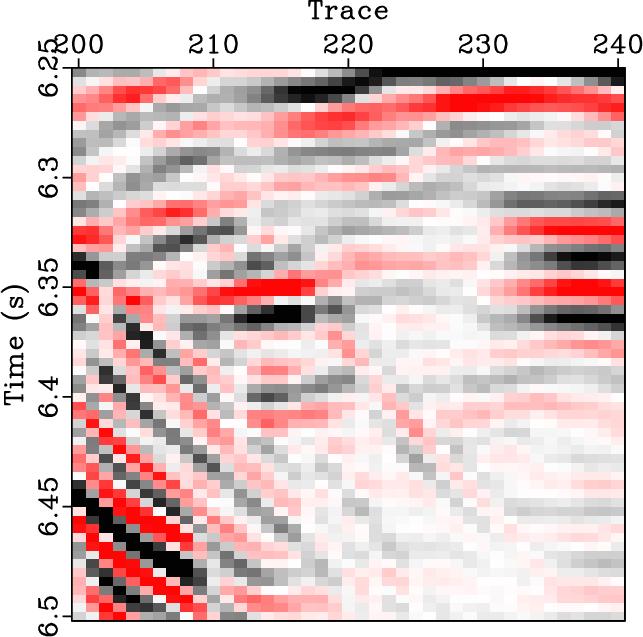
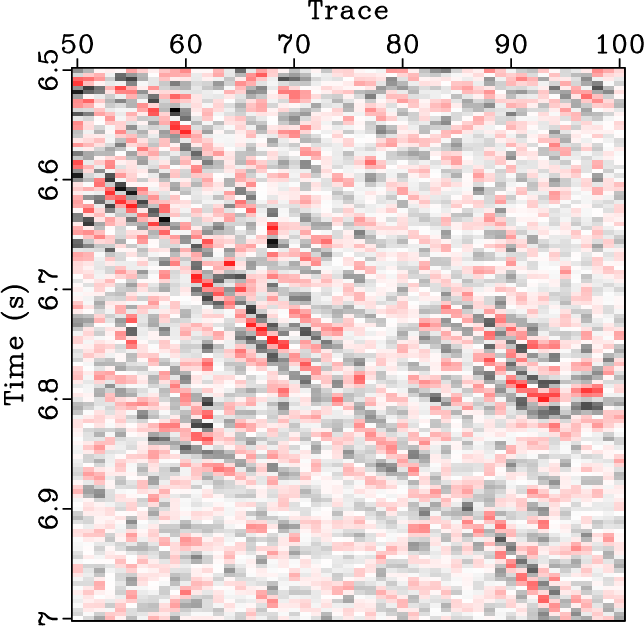
We then compare the migrated reflection and diffraction images using two aforementioned methods in Figure 11. The top row of Figure 11 plots the corresponding reflection images using the velocity continuation method (Fomel, 2003) for the two methods, while Figures 11c and 11d plot the diffraction images. From Figure 11, it is clear that the proposed LRRA method obtains a better diffraction image with an obviously higher resolution. Several distinct imaging areas are highlighted by the frame boxes A, B, and C. At the same time, the reflection image of the LRRA method is more spatially continuous than the PWD method because the amplitude of reflection waves are less damaged during the diffraction separation process of the LRRA method. The migrated reflection images indicate a clear overthrust structure, with the thrust-generated faults highlighted clearly in the diffraction images. We zoom in the three areas referred to by the frame boxes and plot the zoomed sections in Figures 12 and 13. Figure 12 plots the detailed comparison of the reflection images and Figure 13 plots the comparison of the zoomed diffraction images. The top rows of Figures 12 and 13 correspond to the PWD method while the bottom rows correspond to the proposed LRRA method. These detailed comparison further confirms that the proposed LRRA method can obtain a higher resolution in the diffraction image and a better continuity in the reflection image.
We vary the fixed rank from ![]() to
to ![]() for the LRR method gradually and show their corresponding diffraction images in Figure 14. It is salient that the amplitude of diffraction images weakens as we incrase the rank, which is explained by the fact that a larger rank causes less separated diffraction energy. When
for the LRR method gradually and show their corresponding diffraction images in Figure 14. It is salient that the amplitude of diffraction images weakens as we incrase the rank, which is explained by the fact that a larger rank causes less separated diffraction energy. When ![]() , most discontinuities are imaged well but with very low resolution because numerous reflection structures also exist. When
, most discontinuities are imaged well but with very low resolution because numerous reflection structures also exist. When ![]() , the resolution of the diffraction image becomes higher, but it also misses a lot of significant diffraction structures, e.g., around 7.5 s. When
, the resolution of the diffraction image becomes higher, but it also misses a lot of significant diffraction structures, e.g., around 7.5 s. When ![]() , the poor diffraction quality does not provide helpful indications of the subsurface discontinuity structures. Figures 15a-15d compare the diffraction images using the GRR method with ranks of
, the poor diffraction quality does not provide helpful indications of the subsurface discontinuity structures. Figures 15a-15d compare the diffraction images using the GRR method with ranks of
![]() , respectively, in Figure 15. It is clear that when the rank is smaller, e.g.,
, respectively, in Figure 15. It is clear that when the rank is smaller, e.g., ![]() , the diffraction images have low resolutions and more importantly contain a lot of artifacts. When the rank is larger, e.g.,
, the diffraction images have low resolutions and more importantly contain a lot of artifacts. When the rank is larger, e.g., ![]() , the diffraction images fail to depict all the discontinuities and also contain some reflection structures. In conclusion, the GRR method is much more difficult than the LRR method in determining an appropriate compromise between resolution and completeness.
, the diffraction images fail to depict all the discontinuities and also contain some reflection structures. In conclusion, the GRR method is much more difficult than the LRR method in determining an appropriate compromise between resolution and completeness.
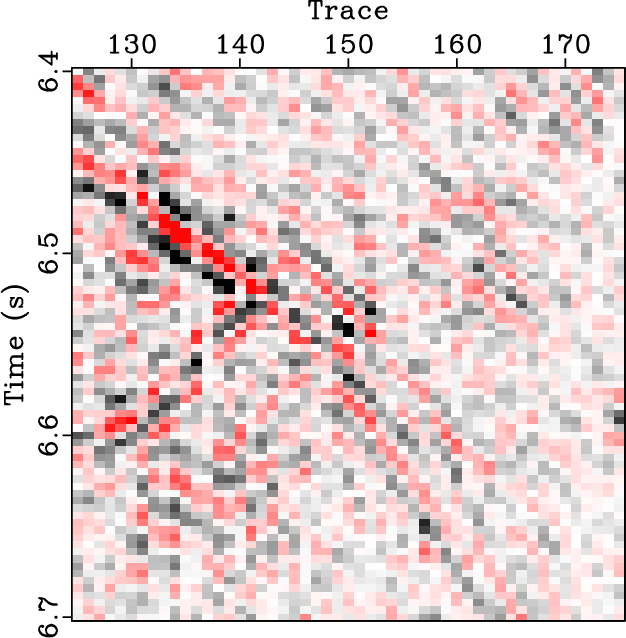
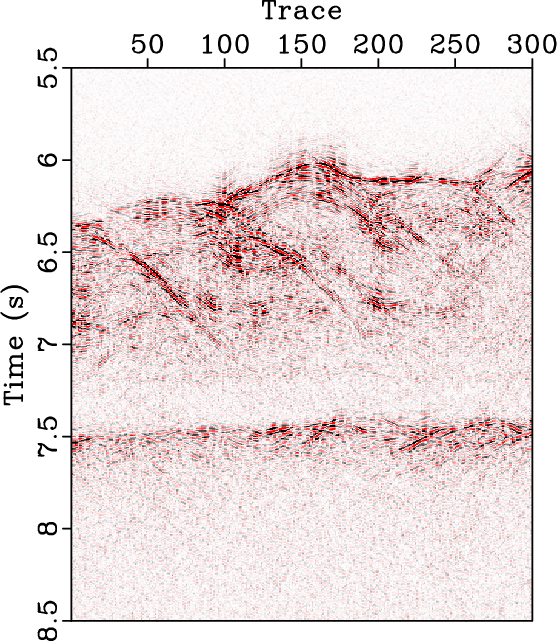
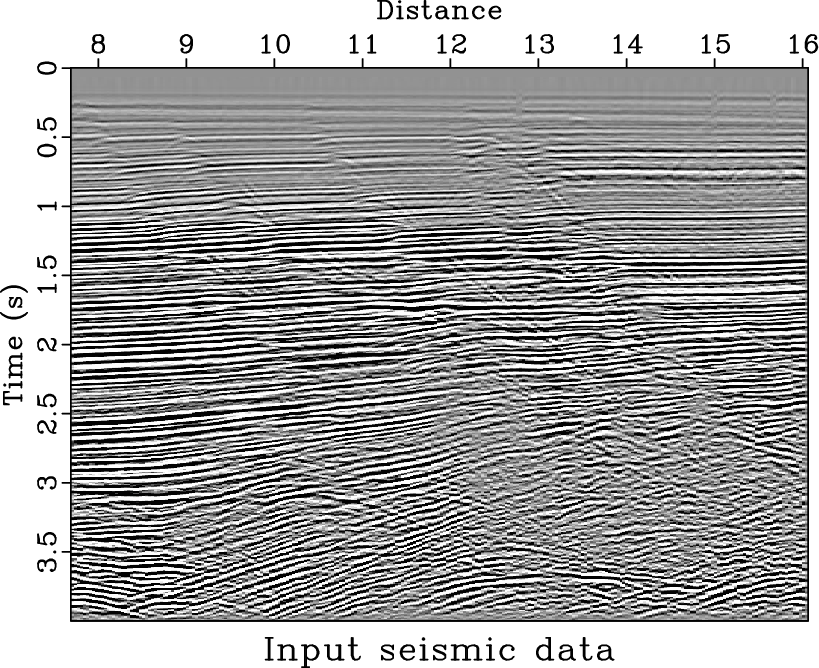
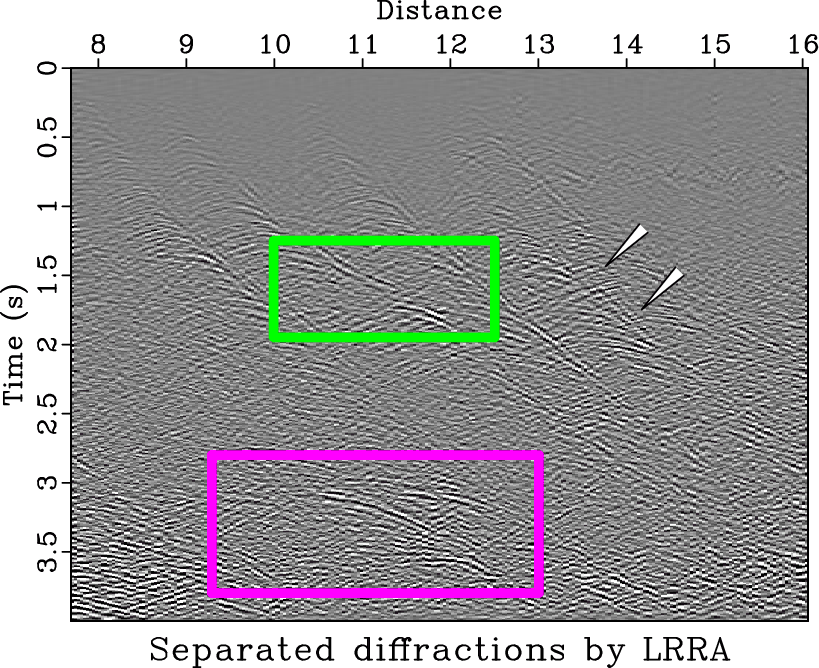
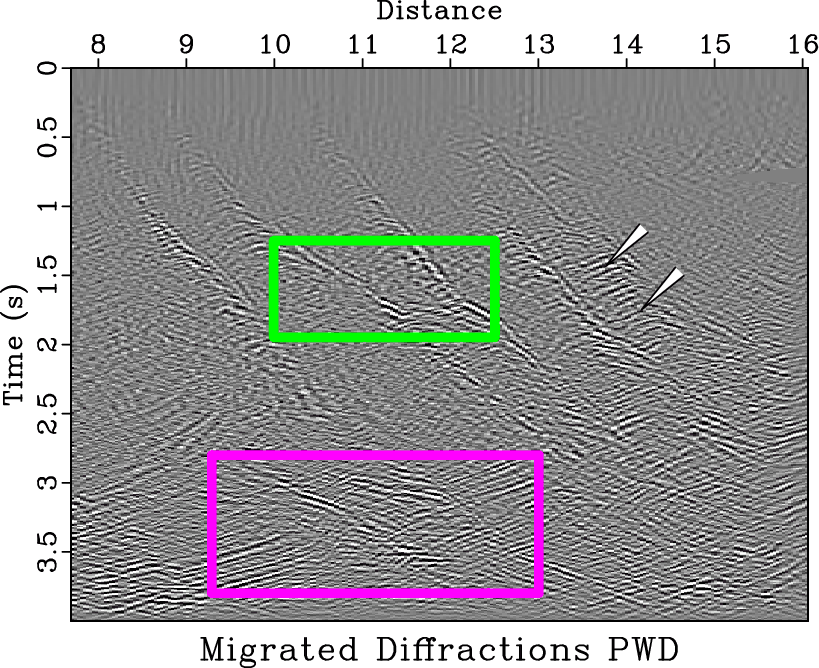
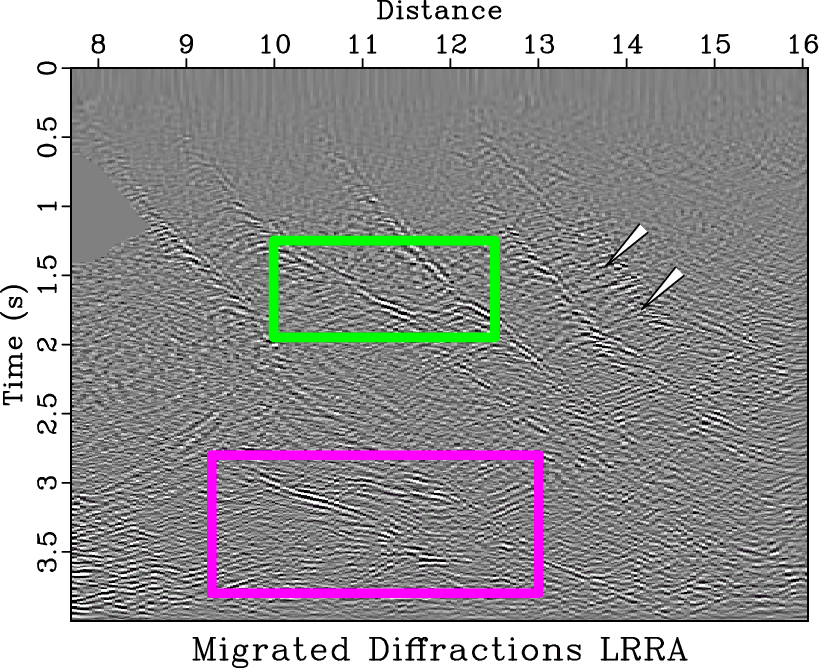
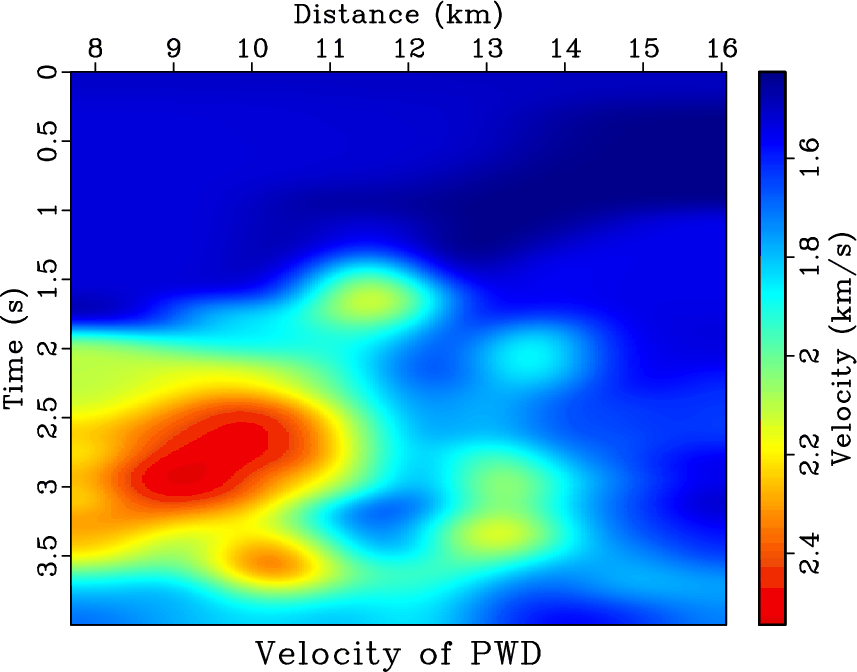
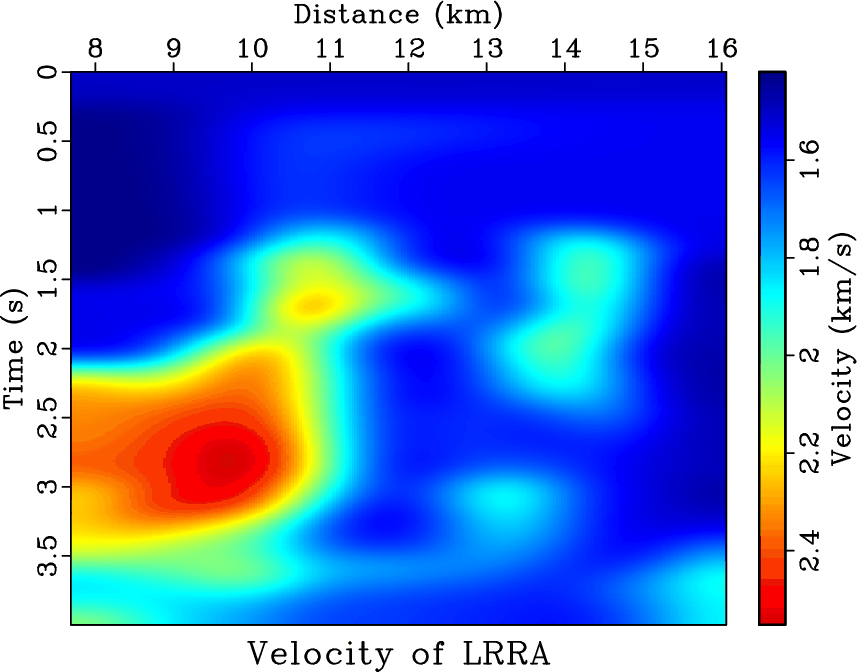
Next, we apply the proposed LRRA method to a real post-stack dataset from the Gulf of Mexico Figure 16. The post-stack seismic image of this dataset is plotted in Figure 16. There are 1000 temporal samples and 250 spatial samples in this dataset. The temporal sampling is 4 ms and the spatial sampling is 0.0335 km. We compare the separated diffraction sections using the PWD and LRRA methods in Figure 17. In this test, we use a localized window with the size of
![]() . It is clear from Figure 17 that the PWD method causes some reflection energy leakage in the separated diffractions while the LRRA method is less likely to cause the reflection leakage problem. The two frame boxes and the two labels in Figure 17 highlight some areas with distinct difference between two sections, e.g., more leaked reflection waves in the PWD result on the left. Figure 18 plots a comparison of the diffraction images using two methods, based on the velocity analysis and diffraction imaging framework introduced in Fomel et al. (2007). The comparison of diffraction images shows that the proposed LRRA method causes fewer reflection structures and a higher spatial migration resolution in the diffraction image, as indicated by the frame boxes and arrows. Figure 19 plots a comparison of the estimated velocity models by focusing the separated diffractions using the PWD method on the left and the LRRA method on the right based on the velocity continuation approach (Fomel, 2003). According to the better focused diffraction image, we consider the velocity model from the LRRA method is more accurate. However, further verification of the velocity model requires more information.
. It is clear from Figure 17 that the PWD method causes some reflection energy leakage in the separated diffractions while the LRRA method is less likely to cause the reflection leakage problem. The two frame boxes and the two labels in Figure 17 highlight some areas with distinct difference between two sections, e.g., more leaked reflection waves in the PWD result on the left. Figure 18 plots a comparison of the diffraction images using two methods, based on the velocity analysis and diffraction imaging framework introduced in Fomel et al. (2007). The comparison of diffraction images shows that the proposed LRRA method causes fewer reflection structures and a higher spatial migration resolution in the diffraction image, as indicated by the frame boxes and arrows. Figure 19 plots a comparison of the estimated velocity models by focusing the separated diffractions using the PWD method on the left and the LRRA method on the right based on the velocity continuation approach (Fomel, 2003). According to the better focused diffraction image, we consider the velocity model from the LRRA method is more accurate. However, further verification of the velocity model requires more information.
|
|---|
|
k-dmo
Figure 9. Input Nankai seismic data. |
|
|


|
|---|
|
k-pwd-ref,k-lrra-ref,k-pwd-dif0,k-lrra-dif0
Figure 10. Separated reflection from (a) PWD method and (b) LRRA method. Separated diffraction from (c) PWD method and (d) LRRA method. |
|
|
|
|---|
|
k-pwd-s0,k-lrra-s0,k-pwd-n0,k-lrra-n0
Figure 11. Comparison of diffraction and reflection images. (a) Reflection image from the PWD method. (b) Reflection image from the LRRA method. (c) Diffraction image from the PWD method. (d) Diffraction image from the LRRA method. |
|
|


|
|---|
|
k-pwd-s-z1,k-pwd-s-z2,k-pwd-s-z3,k-lrra-s-z1,k-lrra-s-z2,k-lrra-s-z3
Figure 12. Zoomed comparison of the reflection image. Top row: PWD method. Bottom row: LRRA method. (a) and (d) correspond to the frame box A in Figure 11. (b) and (e) correspond to the frame box B in Figure 11. (c) and (f) correspond to the frame box C in Figure 11. |
|
|


|
|---|
|
k-pwd-n-z1,k-pwd-n-z2,k-pwd-n-z3,k-lrra-n-z1,k-lrra-n-z2,k-lrra-n-z3
Figure 13. Zoomed comparison of the diffraction image. Top row: PWD method. Bottom row: LRRA method. (a) and (d) correspond to the frame box A in Figure 11. (b) and (e) correspond to the frame box B in Figure 11. (c) and (f) correspond to the frame box C in Figure 11. |
|
|


|
|---|
|
k-lrr-N1-n,k-lrr-N2-n,k-lrr-N3-n,k-lrr-N4-n
Figure 14. Diffraction images from localized rank-reduction method by manually chosen rank. (a) N=1. (b) N=2. (c) N=3. (d) N=4. |
|
|


|
|---|
|
k-grr-N5-n,k-grr-N10-n,k-grr-N20-n,k-grr-N30-n
Figure 15. Diffraction images using global rank-reduction method with N=5 (a), N=10 (b), N=20 (c), and N=30 (d). |
|
|
|
|---|
|
bei-in
Figure 16. Input marine seismic data. |
|
|

|
|---|
|
bei-tra-0,bei-rr-0
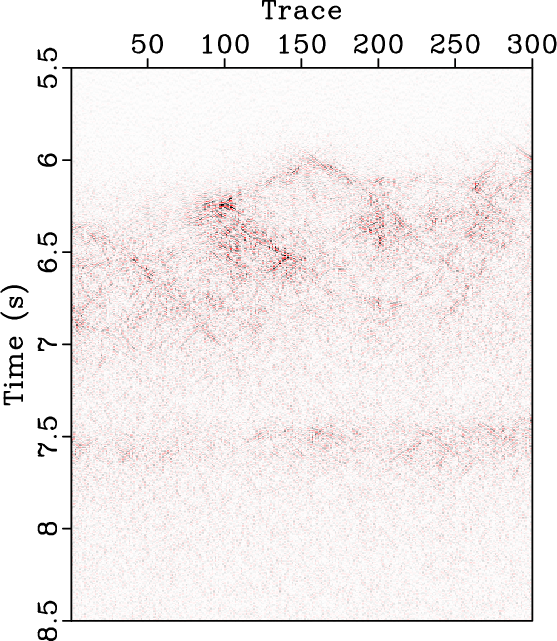
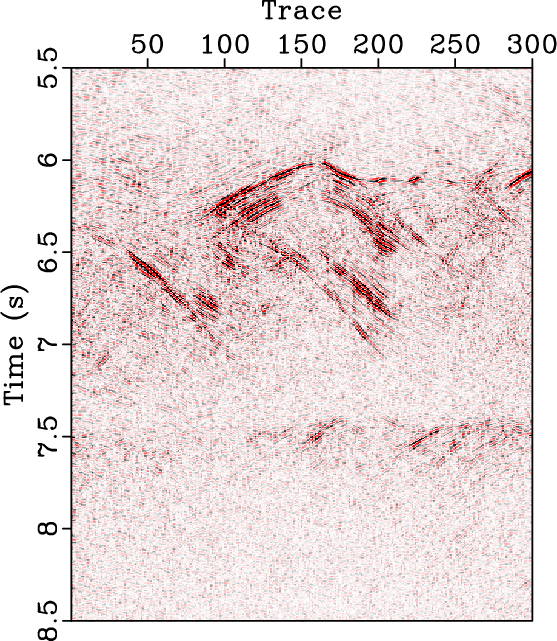
Figure 17. (a) Separated diffractions by PWD. (b) Separated diffractions by LRRA. Note that the PWD method causes more leaked reflection energy as highlighted by the frame boxes and labels. |
|
|
|
|---|
|
bei-tra-slc-0,bei-rr-slc-0
Figure 18. (a) Migrated image using separated diffractions by PWD. (b) Migrated image using separated diffractions by LRRA. Note the less reflection structure and higher resolution obtained from the LRRA method compared with the PWD method. |
|
|
|
|---|
|
bei-tra-pik,bei-rr-pik
Figure 19. (a) Picked velocity profile from separated diffractions by PWD. (b) Picked velocity profile from separated diffractions by LRRA. |
|
|
|
|
|
|
Separation and imaging of seismic diffractions using a localized rank-reduction method with adaptively selected ranks |